Field Notes
<--2018-11-01 12:50:00 | 2018-12-18 09:15:00-->Other sites visited today: Bouldin Alfalfa | Bouldin Corn | East End | East Pond | Sherman Wetland | West Pond | Mayberry
Phenocam link: Searching...
Sherman Barn: 2018-11-28 09:20:00 (DOY 332)
Author: Daphne Szutu
Others: Kyle, Kuno
Summary: Regular data collection/cleaning, water in Picarro box/tubing, first rains last week
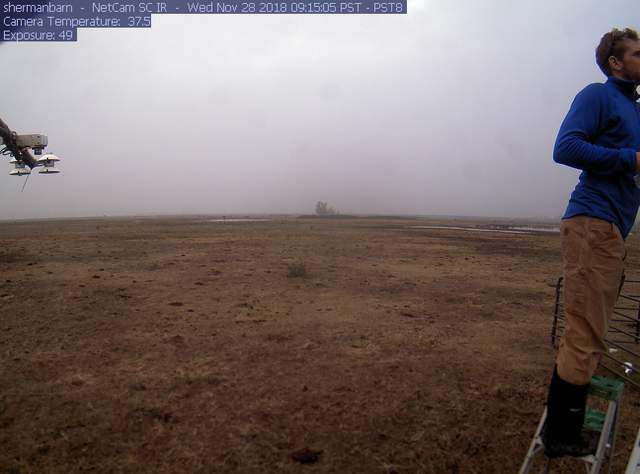
| 2018-11-28 Sherman Barn Kyle, Kuno, and I arrived at 9:20. It was foggy and cool, although occasionally it was sunny enough to make distinct shadows. The field had pools of water on the eastern edge. It has been raining in the past few days and a large storm is expected later that night. The weeds in the exclosure have died down in the past month. I downloaded met, camera, and USB GHG data. There were some ants in the met box so I left a mothball in. Kyle cleaned the flux and rad sensors. The wash reservoir was 2/3 full; we refilled it. LI-7500 readings: CO2 467ppm H2O 667ppm T 13.8C P 101.4kPa SS 102--> 103 after cleaning LI7700 readings: CH4 2.9ppm --> 2.8 after cleaning RSSI 1.3--> 73 after cleaning There was a small pool of water in Kuno’s Picarro box, and there were also some water condensed in the inlet tubes. We left Kuno at the site at 9:40 to clear out the box and the tubing while we went to service SW and MB. The following day, 2018-09-28, Kuno and Tyler went back to the site to check on the Picarro. The inlet filter was full of water, so they’re running box air through the Picarro for now to try to dry it out. They will go back on Monday to check on it. We came back around 11:45 to pick him up. |
1 photos found

shermanbarn_2018_11_28_091505.jpg ( 2018-11-28 09:23:42 ) Full size: 1296x960
Kyle
3 sets found
4 SB_flux graphs found
15 SB_met graphs found
Can't check TATWBABCSB_cam

