
Field Notes
<--2018-08-30 10:00:00 | 2018-09-27 10:10:00-->Other sites visited today: Vaira
Phenocam link: Searching...
Tonzi: 2018-09-13 00:00:00 (DOY 256)
Author: Joe Verfaillie
Others: Daphne, Lin Kroll
Summary: Changed Tower Top CR1000 program, added thremocouples to FLIR case, FLIR locked up this time, reset some of the dendrometers, JPL setting up their solar panels.
| Tonzi 2018-09-13 I arrive at about 8:30 with Daphne. Lin Kroll from JPL met us at the gate to start setting up their solar power system. It was mild with high thin clouds by still very dry and dusty. Cows had gotten through the fences in a couple places. We repaired the fences but still left the fence chargers off due to fire danger. I think I may replace the electric fences with smaller barbed wire fences. Daphne did most of the data collection and field measurements. We did not do midday water potential because Siyan was not able to complete them last time due to the extreme pressures. I rewired and updated the program on the tower top CR1000. I removed code for the LED sensors and HMP45 profile measurements. This left a lot of empty channels on the multiplexor. I moved the BF5, PAR and remaining HMP45 channels up to fill the hole. I also added three thermocouples to differential channels 5, 6 and 7 on the CR1000 for the FLIR enclosure. I added a 24 gauge TC inside the FLIR enclosure and two 40 gauge, fine wire, TCs to the inside and outside of the window. The FW TCs are pressed against the window with a small piece of dense foam held in place with some foam tape. The tape is on the plastic frame holding the window so no adhesive on the window itself. They are at the bottom edge of the window on the inside and outside. We also took a couple of photos holding the black body sensor in front of the camera. We also tested the IRT on the ground with the black body and IRT said 34.4C when the BB said 34.0C. The Latte Panda was running but the camera web server had locked up again with a javascript file running out of memory. I cycled power on the camera to fix it and restarted the Latte Panda just in case. I forgot to copy the images though. I plugged in the other Latte Panda and the screen freaked out a couple of times but seemed to run okay otherwise. Still I don’t feel confident about it and did not swap them. I also got an old relay out of the solar converter box and though about using it to cycle power on the FLIR but it was only rated for 12V. I’ll get a solid state one for next time. I reset some of the dendrometers: C1 was reset from 21.2 to5.4 C8 was reset from 23.7 to 5.6 C7 was reset from 21.2 to 4.8 The Moisture Point probe near the Floor solar panels is dead – it has three broken pins. Lin was setting up their solar system to the west of the tower just outside of the cow fence. I think the system is two 360W, single crystal panels and four batteries. By the time we left he had four concrete piers set up and some of the initial strut work. He will continue tomorrow I think. We left at about 13:15 |
Field Data
No tank data
Well Depth
| Date | Location | Depth (feet) |
|---|---|---|
| 2018-09-13 | TZ_floor | 26.55 |
| 2018-09-13 | TZ_tower | 31.05 |
| 2018-09-13 | TZ_road | 35.5 |
| 2018-09-13 | VR_pond | 13.94 |
mode = both
Moisture Point Probes TZ
Array
(
[0] => Tower_1
[1] => Floor_South_1
[2] => Floor_West_1
[3] => Soil_Transect_4_1
[4] => Soil_Transect_3_1
[5] => Soil_Transect_2_1
[6] => Soil_Transect_1_1
[7] => SoilCO2_West_A_1
[8] => SoilCO2_West_B_1
[9] => SoilCO2_West_C_1
[10] => Tower_2
[11] => Floor_South_2
[12] => Floor_West_2
[13] => Soil_Transect_4_2
[14] => Soil_Transect_3_2
[15] => Soil_Transect_2_2
[16] => Soil_Transect_1_2
[17] => SoilCO2_West_A_2
[18] => SoilCO2_West_B_2
[19] => SoilCO2_West_C_2
[20] => Tower_3
[21] => Floor_South_3
[22] => Floor_West_3
[23] => Soil_Transect_4_3
[24] => Soil_Transect_3_3
[25] => Soil_Transect_2_3
[26] => Soil_Transect_1_3
[27] => SoilCO2_West_A_3
[28] => SoilCO2_West_B_3
[29] => SoilCO2_West_C_3
[30] => Tower_4
[31] => Floor_South_4
[32] => Soil_Transect_4_4
[33] => Soil_Transect_3_4
[34] => Soil_Transect_2_4
[35] => Soil_Transect_1_4
[36] => SoilCO2_West_A_4
[37] => SoilCO2_West_B_4
[38] => SoilCO2_West_C_4
[39] => Floor_West_4
)
| Date | DOY | Rep | Depth | Tower_1 |
Floor_South_1 |
Floor_West_1 |
Soil_Transect_4_1 |
Soil_Transect_3_1 |
Soil_Transect_2_1 |
Soil_Transect_1_1 |
SoilCO2_West_A_1 |
SoilCO2_West_B_1 |
SoilCO2_West_C_1 |
Tower_2 |
Floor_South_2 |
Floor_West_2 |
Soil_Transect_4_2 |
Soil_Transect_3_2 |
Soil_Transect_2_2 |
Soil_Transect_1_2 |
SoilCO2_West_A_2 |
SoilCO2_West_B_2 |
SoilCO2_West_C_2 |
Tower_3 |
Floor_South_3 |
Floor_West_3 |
Soil_Transect_4_3 |
Soil_Transect_3_3 |
Soil_Transect_2_3 |
Soil_Transect_1_3 |
SoilCO2_West_A_3 |
SoilCO2_West_B_3 |
SoilCO2_West_C_3 |
Tower_4 |
Floor_South_4 |
Soil_Transect_4_4 |
Soil_Transect_3_4 |
Soil_Transect_2_4 |
Soil_Transect_1_4 |
SoilCO2_West_A_4 |
SoilCO2_West_B_4 |
SoilCO2_West_C_4 |
Floor_West_4 |
Avg | Spacial Count |
Measurement Count |
|---|---|---|---|---|---|---|---|---|---|---|---|---|---|---|---|---|---|---|---|---|---|---|---|---|---|---|---|---|---|---|---|---|---|---|---|---|---|---|---|---|---|---|---|---|---|---|
| 2018-09-13 | 256 | 0 | nan | 2.7 | 1.2 | 4.2 | 2.2 | 1.2 | 2.7 | 0.4 | 2.7 | 4.7 | 0.3 | 11.2 | 10.3 | 8.1 | 8.4 | 13.3 | 11.8 | 4.2 | 8.4 | 0.3 | 11.5 | 14.3 | 10.9 | 11.5 | 8.1 | 12.9 | 16.2 | 14 | 16.8 | 14.8 | 12.3 | 17 | 3.3 | 11.6 | 17.9 | 26.2 | 11 | 16.5 | 17.9 | 26.8 | ||||
| 2018-09-13 | 256 | 1 | nan | 3 | 0.6 | 4.7 | 9.2 | 1.5 | 3.3 | 1.3 | 2.4 | 5 | 10.9 | 10 | 9 | 8.1 | 13.9 | 11.2 | 4.2 | 8.4 | 1.5 | 11.5 | 14 | 10.3 | 10.9 | 9.8 | 12.6 | 16.2 | 13.7 | 16.8 | 14.8 | 13.1 | 17 | 3.3 | 12.2 | 17.3 | 26.5 | 11.6 | 16.8 | 17.6 | 27.1 | |||||
| 2018-09-13 | 256 | 2 | nan | 0.3 | 5 | 9.2 | 0.7 | 9.3 | 8.7 | 9 | 4.5 | 0.9 | 11.5 | 10.3 | 12.6 | 9.8 | 13.4 | 14.8 | 13.1 | 3 | 10.7 | 11 | 18.2 | 27.9 | 18.5 | |||||||||||||||||||||
| 2018-09-13 | 256 | 3 | nan | 0.6 | 4.7 | 1.2 | 9.7 | 8.1 | 0.6 | 11.5 | 10.3 | 12.3 | 15.1 | 12.9 | 2.7 | 18.2 | 23.9 | 18.8 | ||||||||||||||||||||||||||||
| 2018-09-13 | 256 | 4 | nan | 0.9 | 11.5 | 12.6 | 23.9 | |||||||||||||||||||||||||||||||||||||||
| 2018-09-13 | 256 | Avg | 0-15cm | 0 | 0 | |||||||||||||||||||||||||||||||||||||||||
| 2018-09-13 | 256 | Avg | 15-30cm | 0 | 0 | |||||||||||||||||||||||||||||||||||||||||
| 2018-09-13 | 256 | Avg | 30-45cm | 0 | 0 | |||||||||||||||||||||||||||||||||||||||||
| 2018-09-13 | 256 | Avg | 45-60cm | 0 | 0 |
mode = both
Moisture Point Probes VR
Array
(
[0] => Flux_Tower_1
[1] => Gate_1
[2] => Biomass_Cage_1
[3] => Solar_Panels_2
[4] => Flux_Tower_2
[5] => Gate_2
[6] => Biomass_Cage_2
[7] => Solar_Panels_3
[8] => Flux_Tower_3
[9] => Gate_3
[10] => Biomass_Cage_3
[11] => Solar_Panels_4
[12] => Flux_Tower_4
[13] => Gate_4
[14] => Biomass_Cage_4
[15] => Solar_Panels_1
)
| Date | DOY | Rep | Depth | Flux_Tower_1 |
Gate_1 |
Biomass_Cage_1 |
Solar_Panels_2 |
Flux_Tower_2 |
Gate_2 |
Biomass_Cage_2 |
Solar_Panels_3 |
Flux_Tower_3 |
Gate_3 |
Biomass_Cage_3 |
Solar_Panels_4 |
Flux_Tower_4 |
Gate_4 |
Biomass_Cage_4 |
Solar_Panels_1 |
Avg | Spacial Count |
Measurement Count |
|---|---|---|---|---|---|---|---|---|---|---|---|---|---|---|---|---|---|---|---|---|---|---|
| 2018-09-13 | 256 | 0 | nan | 1 | 7.1 | 1.2 | 7.8 | 7.8 | 4.2 | 5.7 | 14.5 | 6.4 | 8.1 | 16.8 | 28.5 | 15 | 21.3 | 19.3 | ||||
| 2018-09-13 | 256 | 1 | nan | 0.1 | 7.1 | 0.9 | 7.5 | 7.8 | 4.2 | 5.4 | 14.5 | 5.9 | 8.1 | 16.8 | 28.5 | 13.9 | 20.8 | 19.9 | ||||
| 2018-09-13 | 256 | 2 | nan | 0.3 | 6.9 | 8.1 | 14.5 | 6.2 | 28.8 | 14.2 | 4.5 | |||||||||||
| 2018-09-13 | 256 | 3 | nan | 7.2 | 14.3 | 4.2 | ||||||||||||||||
| 2018-09-13 | 256 | Avg | 0-15cm | 0 | 0 | |||||||||||||||||
| 2018-09-13 | 256 | Avg | 15-30cm | 0 | 0 | |||||||||||||||||
| 2018-09-13 | 256 | Avg | 30-45cm | 0 | 0 | |||||||||||||||||
| 2018-09-13 | 256 | Avg | 45-60cm | 0 | 0 |
No TZ grass heigth found
No VR grass heigth found
Tree DBH
| Date | Tag# | Reading (mm) |
|---|---|---|
| 2018-09-13 | 1 | 5.4 |
| 2018-09-13 | 1 | 21.2 |
| 2018-09-13 | 102 | 10.6 |
| 2018-09-13 | 2 | 19.8 |
| 2018-09-13 | 245 | 8.0 |
| 2018-09-13 | 3 | 22.1 |
| 2018-09-13 | 4 | 9.0 |
| 2018-09-13 | 5 | 7.4 |
| 2018-09-13 | 7 | 4.8 |
| 2018-09-13 | 7 | 21.2 |
| 2018-09-13 | 72 | 15.4 |
| 2018-09-13 | 79 | 12.4 |
| 2018-09-13 | 8 | 5.6 |
| 2018-09-13 | 8 | 24.0 |
No water potential data found
No TZ Grass Biomass data found
No TZ OakLeaves Biomass data found
No TZ PineNeedles Biomass data found
1 photos found
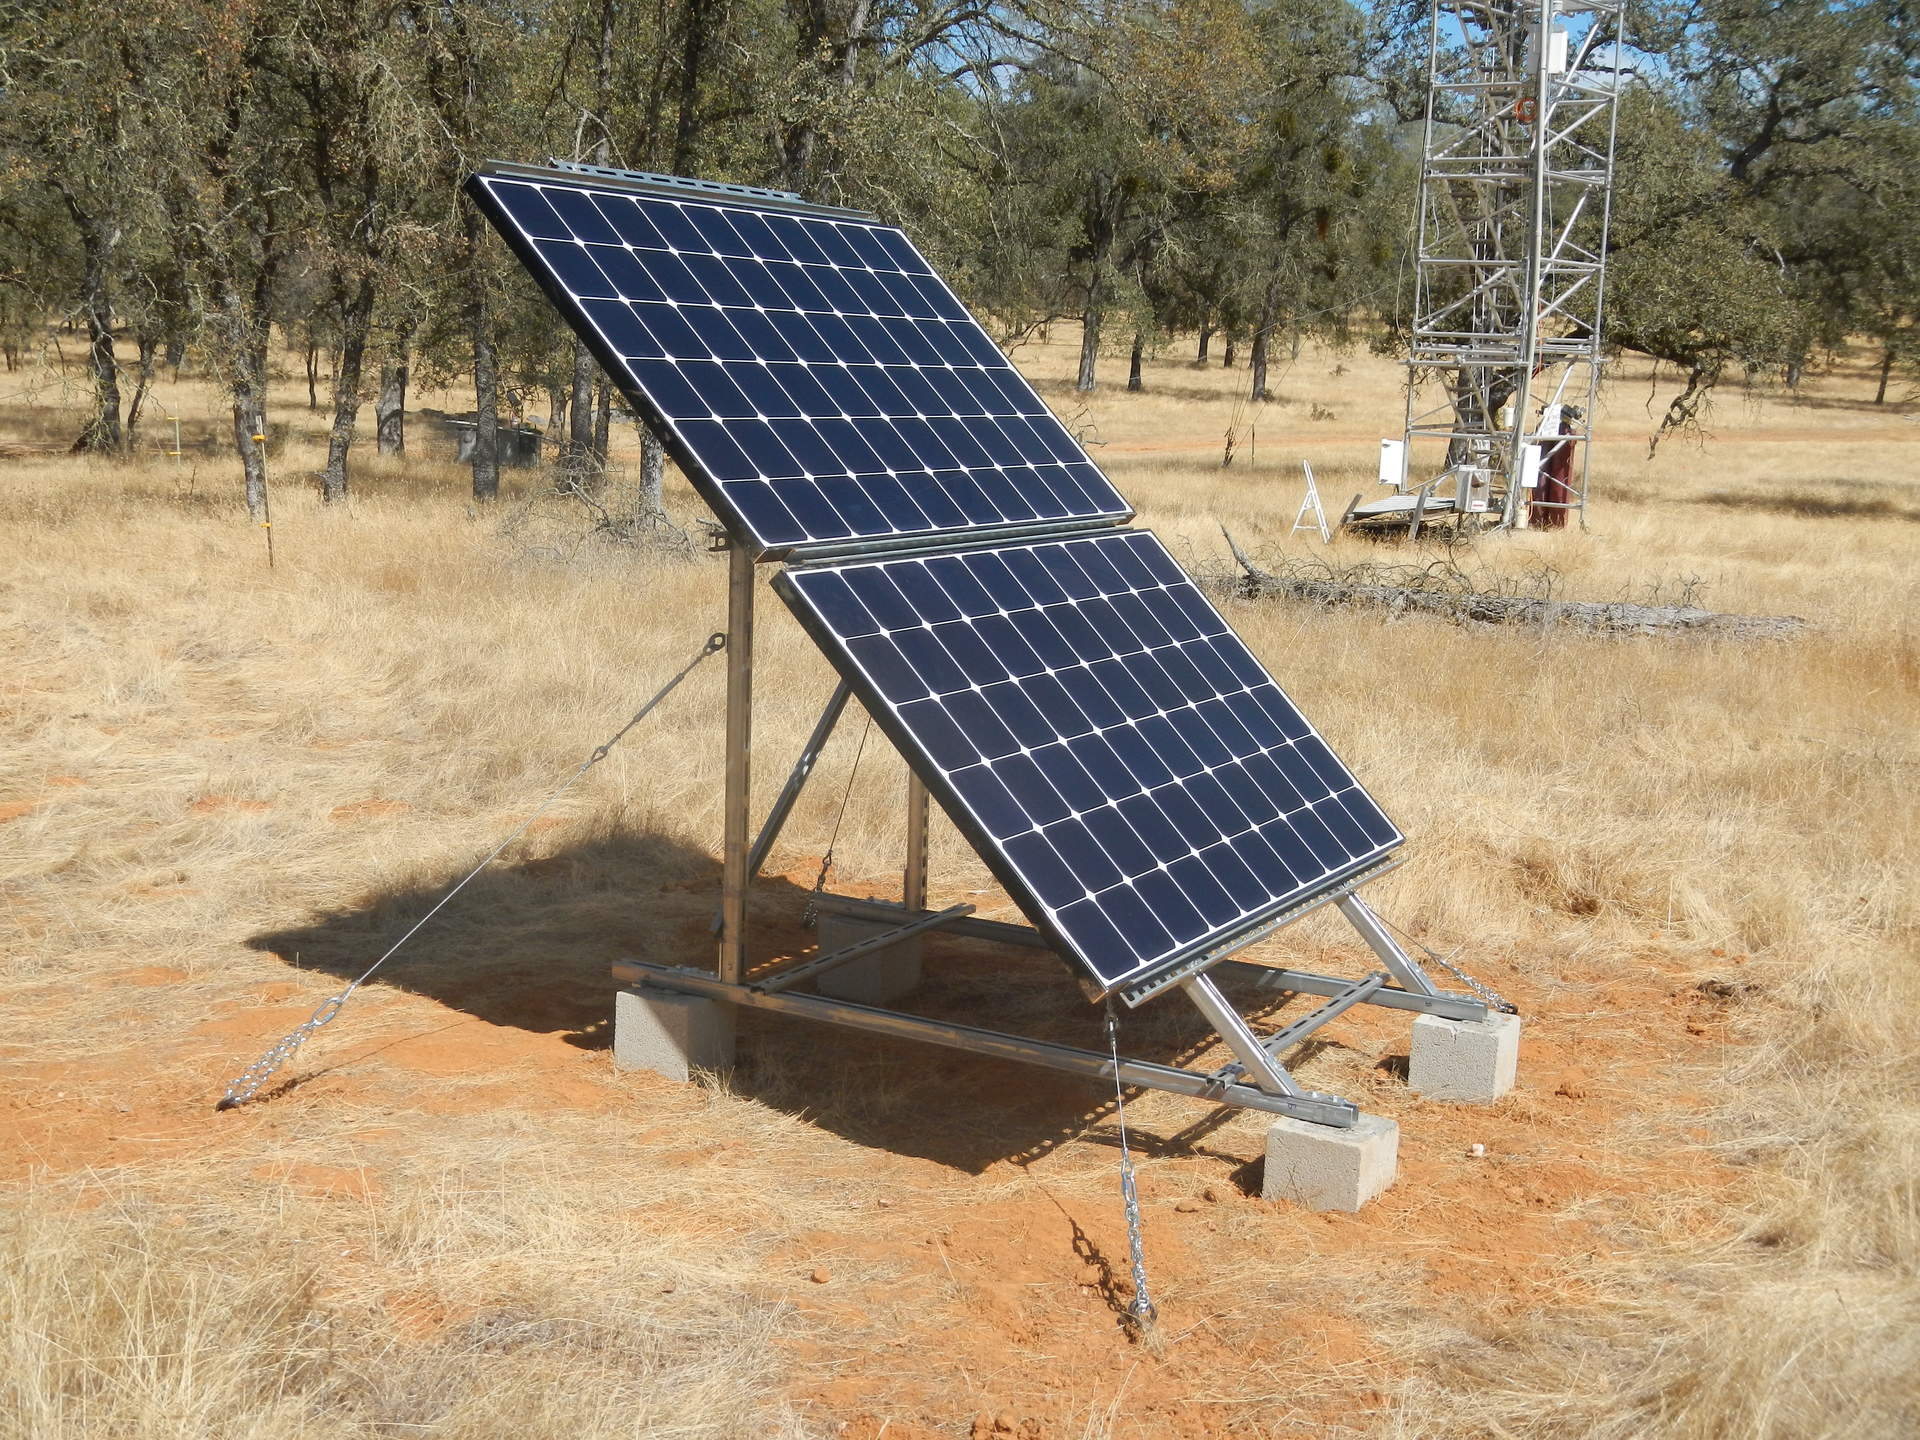
20180914TZ_JPLSolarPanels.jpg ( 2018-09-14 14:22:36 ) Full size: 1920x1440
JPL's nuclear bomb proof solar panels.
16 sets found
No data found for TZ_Fenergy.
11 TZ_tmet graphs found
11 TZ_soilco2 graphs found
Can't check TZ_mixed
3 TZ_mixed graphs found
1 TZ_fflux graphs found
8 TZ_fmet graphs found
No data found for TZ_tram.
3 TZ_co2prof graphs found
1 TZ_irt graphs found
No data found for TZ_windprof.
1 TZ_tflux graphs found
2 TZ_sm graphs found
Can't check TZ_met
1 TZ_met graphs found
Can't check TZVR_mixed
8 TZ_osu graphs found
No data found for TZ_fd.
Tonzi Z-cam data