
Field Notes
<--2018-08-30 13:00:00 | 2018-09-27 09:25:00-->Other sites visited today: Tonzi
Phenocam link: Searching...
Vaira: 2018-09-13 13:20:00 (DOY 256)
Author: Joe Verfaillie
Others: Daphne
Summary: Regular data collection, no spectra, went to the pond.
| Varia 2018-09-13 I arrived at about 13:20 with Daphne. It was warm with some high thin clouds. It was not backing hot but still very dry and dusty. The water hole near the road was bone dry. We quickly collected the tower and soil moisture data and then went to the pond. The pond water level was 13.94ft. There was some jiggles in the data that might have been caused by cows tripping over the cable conduit. The cows have been working over vegetation on the levee. I can’t imagine cockle burs taste all that good. We left at about 14:00 |
Field Data
No tank data
Well Depth
| Date | Location | Depth (feet) |
|---|---|---|
| 2018-09-13 | TZ_floor | 26.55 |
| 2018-09-13 | TZ_tower | 31.05 |
| 2018-09-13 | TZ_road | 35.5 |
| 2018-09-13 | VR_pond | 13.94 |
mode = both
Moisture Point Probes TZ
Array
(
[0] => Tower_1
[1] => Floor_South_1
[2] => Floor_West_1
[3] => Soil_Transect_4_1
[4] => Soil_Transect_3_1
[5] => Soil_Transect_2_1
[6] => Soil_Transect_1_1
[7] => SoilCO2_West_A_1
[8] => SoilCO2_West_B_1
[9] => SoilCO2_West_C_1
[10] => Tower_2
[11] => Floor_South_2
[12] => Floor_West_2
[13] => Soil_Transect_4_2
[14] => Soil_Transect_3_2
[15] => Soil_Transect_2_2
[16] => Soil_Transect_1_2
[17] => SoilCO2_West_A_2
[18] => SoilCO2_West_B_2
[19] => SoilCO2_West_C_2
[20] => Tower_3
[21] => Floor_South_3
[22] => Floor_West_3
[23] => Soil_Transect_4_3
[24] => Soil_Transect_3_3
[25] => Soil_Transect_2_3
[26] => Soil_Transect_1_3
[27] => SoilCO2_West_A_3
[28] => SoilCO2_West_B_3
[29] => SoilCO2_West_C_3
[30] => Tower_4
[31] => Floor_South_4
[32] => Soil_Transect_4_4
[33] => Soil_Transect_3_4
[34] => Soil_Transect_2_4
[35] => Soil_Transect_1_4
[36] => SoilCO2_West_A_4
[37] => SoilCO2_West_B_4
[38] => SoilCO2_West_C_4
[39] => Floor_West_4
)
| Date | DOY | Rep | Depth | Tower_1 |
Floor_South_1 |
Floor_West_1 |
Soil_Transect_4_1 |
Soil_Transect_3_1 |
Soil_Transect_2_1 |
Soil_Transect_1_1 |
SoilCO2_West_A_1 |
SoilCO2_West_B_1 |
SoilCO2_West_C_1 |
Tower_2 |
Floor_South_2 |
Floor_West_2 |
Soil_Transect_4_2 |
Soil_Transect_3_2 |
Soil_Transect_2_2 |
Soil_Transect_1_2 |
SoilCO2_West_A_2 |
SoilCO2_West_B_2 |
SoilCO2_West_C_2 |
Tower_3 |
Floor_South_3 |
Floor_West_3 |
Soil_Transect_4_3 |
Soil_Transect_3_3 |
Soil_Transect_2_3 |
Soil_Transect_1_3 |
SoilCO2_West_A_3 |
SoilCO2_West_B_3 |
SoilCO2_West_C_3 |
Tower_4 |
Floor_South_4 |
Soil_Transect_4_4 |
Soil_Transect_3_4 |
Soil_Transect_2_4 |
Soil_Transect_1_4 |
SoilCO2_West_A_4 |
SoilCO2_West_B_4 |
SoilCO2_West_C_4 |
Floor_West_4 |
Avg | Spacial Count |
Measurement Count |
|---|---|---|---|---|---|---|---|---|---|---|---|---|---|---|---|---|---|---|---|---|---|---|---|---|---|---|---|---|---|---|---|---|---|---|---|---|---|---|---|---|---|---|---|---|---|---|
| 2018-09-13 | 256 | 0 | nan | 2.7 | 1.2 | 4.2 | 2.2 | 1.2 | 2.7 | 0.4 | 2.7 | 4.7 | 0.3 | 11.2 | 10.3 | 8.1 | 8.4 | 13.3 | 11.8 | 4.2 | 8.4 | 0.3 | 11.5 | 14.3 | 10.9 | 11.5 | 8.1 | 12.9 | 16.2 | 14 | 16.8 | 14.8 | 12.3 | 17 | 3.3 | 11.6 | 17.9 | 26.2 | 11 | 16.5 | 17.9 | 26.8 | ||||
| 2018-09-13 | 256 | 1 | nan | 3 | 0.6 | 4.7 | 9.2 | 1.5 | 3.3 | 1.3 | 2.4 | 5 | 10.9 | 10 | 9 | 8.1 | 13.9 | 11.2 | 4.2 | 8.4 | 1.5 | 11.5 | 14 | 10.3 | 10.9 | 9.8 | 12.6 | 16.2 | 13.7 | 16.8 | 14.8 | 13.1 | 17 | 3.3 | 12.2 | 17.3 | 26.5 | 11.6 | 16.8 | 17.6 | 27.1 | |||||
| 2018-09-13 | 256 | 2 | nan | 0.3 | 5 | 9.2 | 0.7 | 9.3 | 8.7 | 9 | 4.5 | 0.9 | 11.5 | 10.3 | 12.6 | 9.8 | 13.4 | 14.8 | 13.1 | 3 | 10.7 | 11 | 18.2 | 27.9 | 18.5 | |||||||||||||||||||||
| 2018-09-13 | 256 | 3 | nan | 0.6 | 4.7 | 1.2 | 9.7 | 8.1 | 0.6 | 11.5 | 10.3 | 12.3 | 15.1 | 12.9 | 2.7 | 18.2 | 23.9 | 18.8 | ||||||||||||||||||||||||||||
| 2018-09-13 | 256 | 4 | nan | 0.9 | 11.5 | 12.6 | 23.9 | |||||||||||||||||||||||||||||||||||||||
| 2018-09-13 | 256 | Avg | 0-15cm | 0 | 0 | |||||||||||||||||||||||||||||||||||||||||
| 2018-09-13 | 256 | Avg | 15-30cm | 0 | 0 | |||||||||||||||||||||||||||||||||||||||||
| 2018-09-13 | 256 | Avg | 30-45cm | 0 | 0 | |||||||||||||||||||||||||||||||||||||||||
| 2018-09-13 | 256 | Avg | 45-60cm | 0 | 0 |
mode = both
Moisture Point Probes VR
Array
(
[0] => Flux_Tower_1
[1] => Gate_1
[2] => Biomass_Cage_1
[3] => Solar_Panels_2
[4] => Flux_Tower_2
[5] => Gate_2
[6] => Biomass_Cage_2
[7] => Solar_Panels_3
[8] => Flux_Tower_3
[9] => Gate_3
[10] => Biomass_Cage_3
[11] => Solar_Panels_4
[12] => Flux_Tower_4
[13] => Gate_4
[14] => Biomass_Cage_4
[15] => Solar_Panels_1
)
| Date | DOY | Rep | Depth | Flux_Tower_1 |
Gate_1 |
Biomass_Cage_1 |
Solar_Panels_2 |
Flux_Tower_2 |
Gate_2 |
Biomass_Cage_2 |
Solar_Panels_3 |
Flux_Tower_3 |
Gate_3 |
Biomass_Cage_3 |
Solar_Panels_4 |
Flux_Tower_4 |
Gate_4 |
Biomass_Cage_4 |
Solar_Panels_1 |
Avg | Spacial Count |
Measurement Count |
|---|---|---|---|---|---|---|---|---|---|---|---|---|---|---|---|---|---|---|---|---|---|---|
| 2018-09-13 | 256 | 0 | nan | 1 | 7.1 | 1.2 | 7.8 | 7.8 | 4.2 | 5.7 | 14.5 | 6.4 | 8.1 | 16.8 | 28.5 | 15 | 21.3 | 19.3 | ||||
| 2018-09-13 | 256 | 1 | nan | 0.1 | 7.1 | 0.9 | 7.5 | 7.8 | 4.2 | 5.4 | 14.5 | 5.9 | 8.1 | 16.8 | 28.5 | 13.9 | 20.8 | 19.9 | ||||
| 2018-09-13 | 256 | 2 | nan | 0.3 | 6.9 | 8.1 | 14.5 | 6.2 | 28.8 | 14.2 | 4.5 | |||||||||||
| 2018-09-13 | 256 | 3 | nan | 7.2 | 14.3 | 4.2 | ||||||||||||||||
| 2018-09-13 | 256 | Avg | 0-15cm | 0 | 0 | |||||||||||||||||
| 2018-09-13 | 256 | Avg | 15-30cm | 0 | 0 | |||||||||||||||||
| 2018-09-13 | 256 | Avg | 30-45cm | 0 | 0 | |||||||||||||||||
| 2018-09-13 | 256 | Avg | 45-60cm | 0 | 0 |
No TZ grass heigth found
No VR grass heigth found
No VR Tree DBH found
No water potential data found
No VR Grass Biomass data found
No VR OakLeaves Biomass data found
No VR PineNeedles Biomass data found
1 photos found
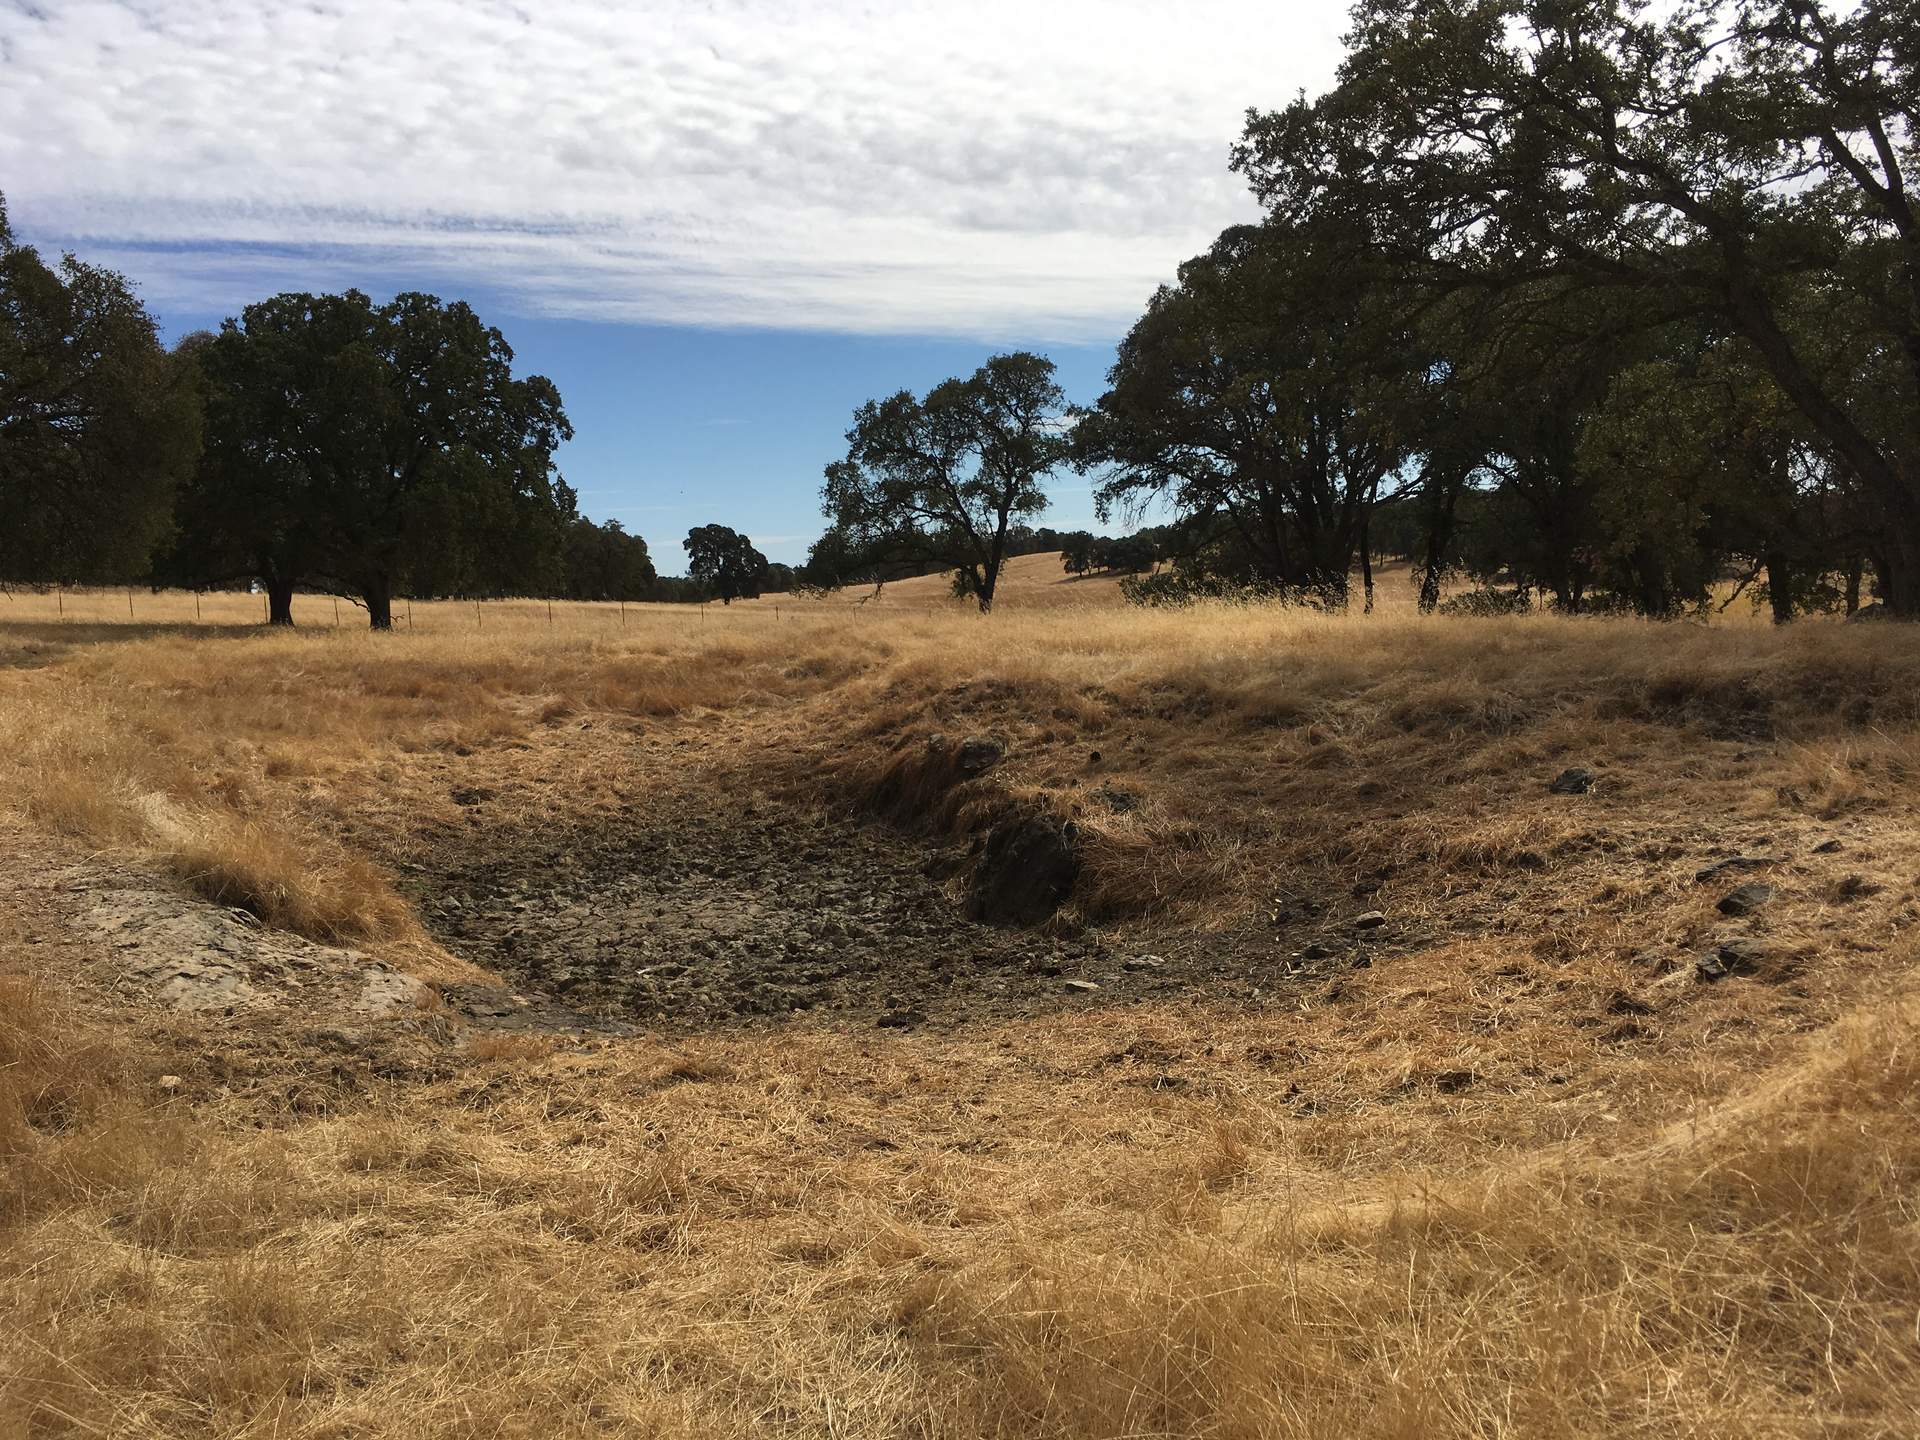
20180913VR_WaterHole.jpg ( 2018-09-13 14:05:41 ) Full size: 1920x1440
Water hole is dry.
9 sets found
16 VR_met graphs found
2 VR_flux graphs found
6 VR_soilco2 graphs found
2 VR_pond graphs found
Can't check TZVR_mixed
No data found for VR_fd.
No data found for VR_processed.
No data found for VR_arable.
No data found for VR_soilvue.