
Field Notes
<--2017-12-18 11:10:00 | 2018-01-04 10:45:00-->Other sites visited today: Bouldin Alfalfa | Bouldin Corn
Phenocam link: Searching...
Twitchell Alfalfa: 2017-12-19 12:30:00 (DOY 353)
Author: Joe Verfaillie
Others:
Summary: Shutdown and removed HMP inter-comparison, copies TA AirT/RH data into TA_met_20180111
| Twitchell Alfalfa 2017-12-19 I arrived about 12:30. It was cool with a thin overcast and a breeze from the southwest. The HMP comparison was still running strong. I checked the data and then shut it down. I tried to be careful taking it down to make sure all the important information about its configuration was written down. I cleaned some spiders and webs out of the TA HMP60 shield before restoring it to its normal location and rewiring it to the CR1000 met data logger. I returned the other HMPs and their shields to their respective sites and locations. Removed: sn W0730036 HMP45 sn G4540021 HMP60 sn U3030041 HMP45 sn G4540023 HMP60 sn G4540025 HMP60 sn T2130005 HMP45 sn L2310736 HMP60 sn U2120013 HMP45 sn L2310711 HMP60 sn U3030046 HMP45 sn T1250012 HMP45 sn 2303 23x moved: sn L1740420 HMP60 Note 2019-03-22 by Daphne Szutu: I updated TA_met_20180111.dat (J:\FieldData\TwitchellAlfalfa\TA_2018\TA_met_2018) with Air T and RH data from the TA sensor (sn L1740420). This data was stored on the comparison datalogger instead of on the TA met CR1000 datalogger. The comparison was at 10-min interval, so I averaged the values to 30-minute intervals, pasted it into the .dat file, and uploaded it to the database. We'll now be able to fill Air T and RH gaps from other sites with the TA_met data. |
1 photos found
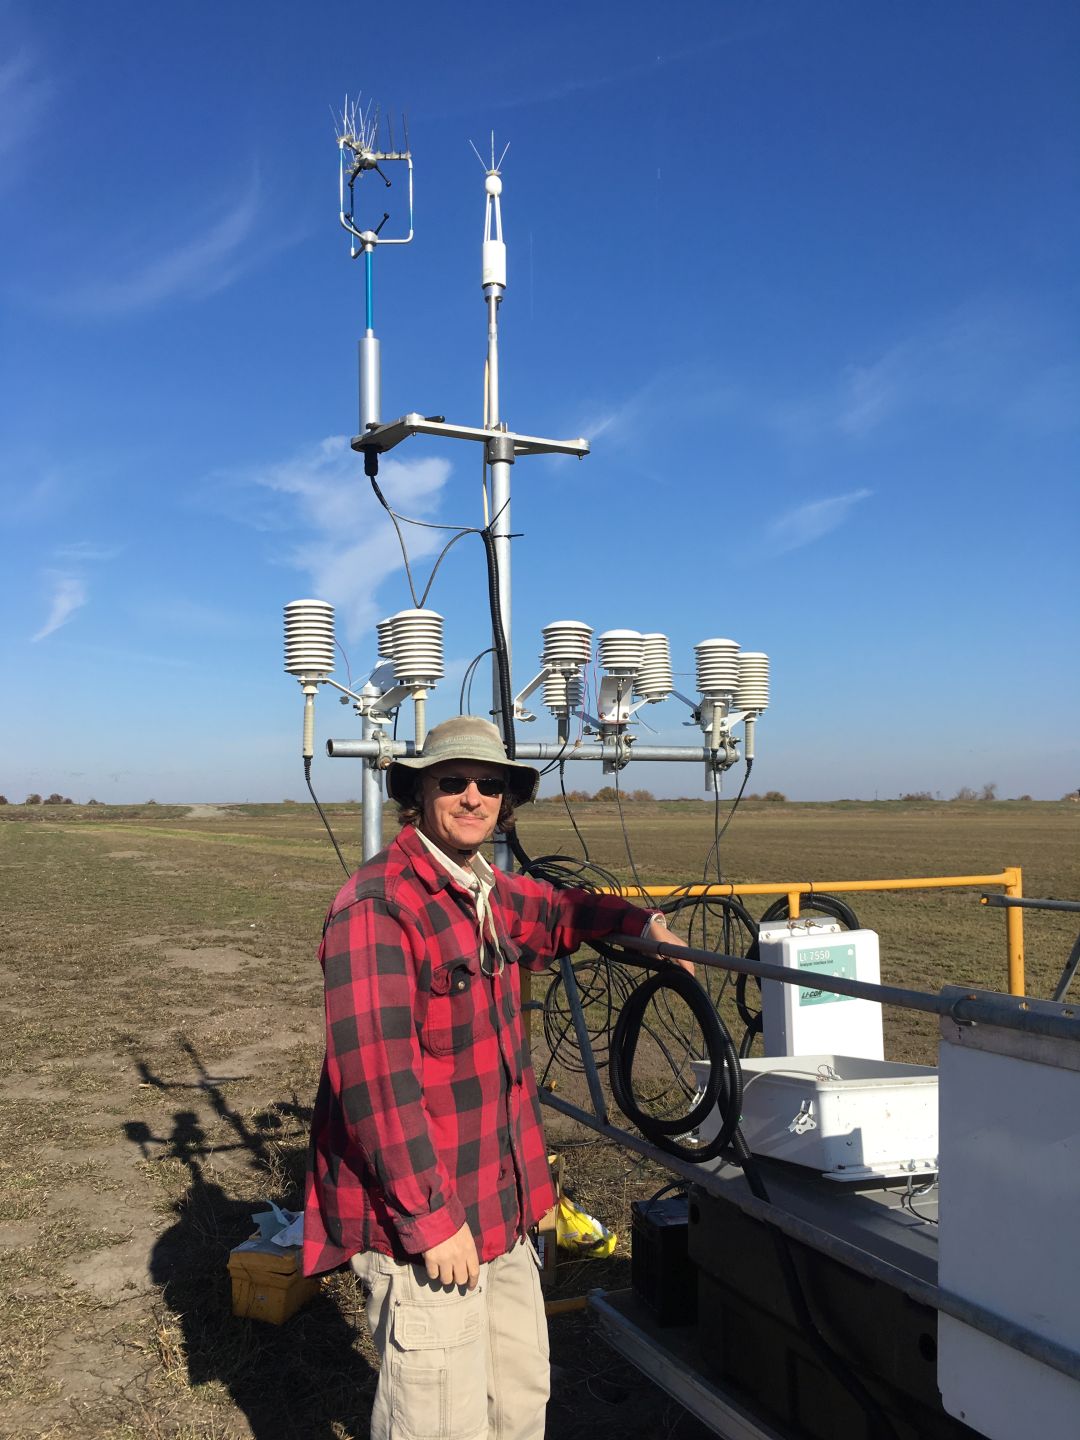
20171218_JoeHMPtree.JPG ( 2017-12-18 12:01:37 ) Full size: 1080x1440
Joe with 9 out of 12 AirT/RH sensors set up for testing. The last three sensor will go on the post supporting the flux sensors.
7 sets found
Can't check TA_met
11 TA_met graphs found
Can't check TA_rad
3 TA_rad graphs found
Can't check TA_flux
5 TA_flux graphs found
Can't check TA_soilco2
7 TA_soilco2 graphs found
1 TA_arable graphs found
1 TA_cam graphs found
Can't check TATWBABCSB_cam