Field Notes

<--2017-11-30 14:25:00 | 2017-12-19 12:30:00-->
Other sites visited today: Sherman Wetland | Mayberry | West Pond | East End

Twitchell Alfalfa: 2017-12-18 11:10:00 (DOY 352)
Author: Daphne Szutu
Others: Dennis, Joe, Sam, Maricar Aguilos

Summary: Set up HMP field comparison, Moved HMP60 to CR23x for field comparison, Swap LI-7500 for calibration, Downgrade LI-7550 to 8.5.0, regular data collection/cleaning

2017-12-18
Twitchell Alfalfa

We arrived at 11:10. It was sunny and cool with thin wispy clouds and haze at the horizon. The sheep have thoroughly grazed our field. Joe scattered some castor oil pellets around the tower to discourage the ground squirrels.

We swapped the LI-7500: sn 75H-2514 went up, sn 0035 came down. I downgraded the embedded software for LI-7550 sn AIU-1557 from 8.7.5 to 8.5.0 to match with the calibrated sensor. I updated the configuration file, changed the pressure coefficient, and reset the box.
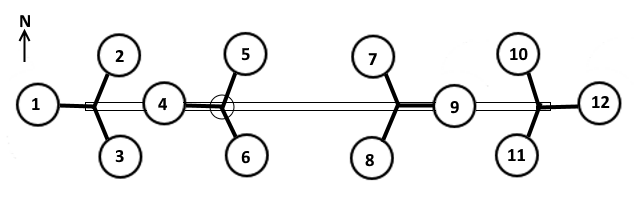
LI-7500 readings:
(sn 0035 before cleaning --> sn 75H-2514 after cleaning)
CO2 398 ppm --> 428 --> 440
H2O 578 mmol/m3 --> 290 --> 290
T 15.4 C --> 15.0 --> 15.7
P 102.3 kPa --> 102.3 --> 102.2
SS 85 --> 99 --> 103

I downloaded met, camera, soil CO2, and USB GHG data. Dennis cleaned the radiation and flux sensors. Sam did soil respiration. Joe re-focused the stardot camera.

We tested the tipping bucket and found that it was under-reporting rainfall: the program is scanning every 500 msec because of the rotating shadow band, so the rainfall is only recording if that 500 msec measurement corresponds to the regular 10 sec scanning interval. Once we move the rotating shadow band to a CR10x, this won't be a problem.

Joe set up 12 HMP sensors on the tower for a field comparison, 6 HMP60 and 6 HMP45. All sensors (except for one HMP45) are aspirated.

I re-wired the HMP60 from the TA met CR1000 to the HMP comparison CR23x because we are writing data every 10 minutes for the comparison.

The HMP cable and sensor are swapped for sn G4540021 and sn L1740420.

HMPCompareFig.png

LocationSerial No.SiteModelWiringData OrderLast CalFan
1sn W0730036LabHMP45SE 17, 1892017-05-0512V 0.1A 0.17m3/min
2sn G4540021MasterHMP60SE 1, 212017-04-0312V 0.04A, 0.11m3/min
3sn U3030041LabHMP45SE 15, 1682009-12-01No Fan
4sn G4540023EEHMP60SE 9, 1052012-03-12Unknown
5sn G4540025WPHMP60SE 7, 842012-03-12Unknown
6sn L1740420TAHMP60SE 11, 1262015-09-2824V 0.09A 0.19m3/min
7sn T2130005LabHMP45SE 21, 2211From Siyan12V 0.1A 0.17m3/min
8sn L2310736SWHMP60SE 5, 632015-09-28Unknown
9sn U2120013MBHMP45SE 13, 1471999-08-18Unknown
10sn L2310711LabHMP60SE 3, 422015-09-2812V 0.04A, 0.11m3/min
11sn U3030046LabHMP45SE 23, 24122012-04-1712V 0.1A 0.17m3/min fan
12sn T1250012LabHMP45SE 19, 2010From Siyan12V 0.1A 0.17m3/min fan

While Joe was setting this up, the rest of us went to EE and WP. We came back to pick up Joe and left at 14:05.

2 photos found

Joe with 9 out of 12 AirT/RH sensors set up for testing. The last three sensor will go on the post supporting the flux sensors.
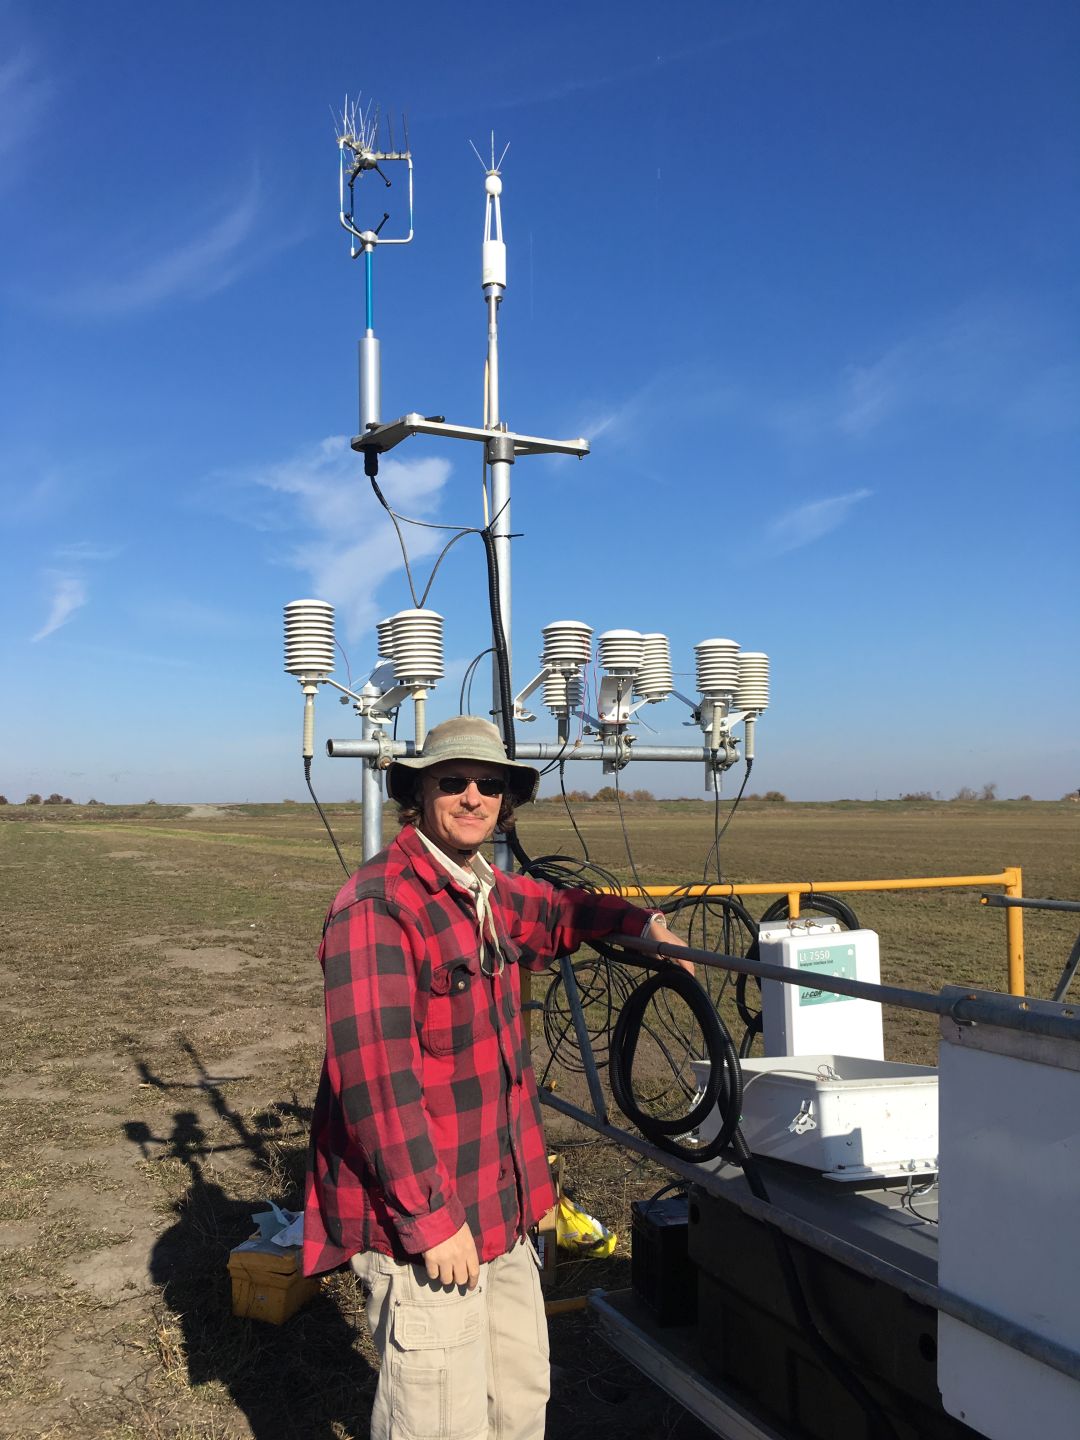
20171218_JoeHMPtree.JPG ( 2017-12-18 12:01:37 ) Full size: 1080x1440
Joe with 9 out of 12 AirT/RH sensors set up for testing. The last three sensor will go on the post supporting the flux sensors.

Lots of birds
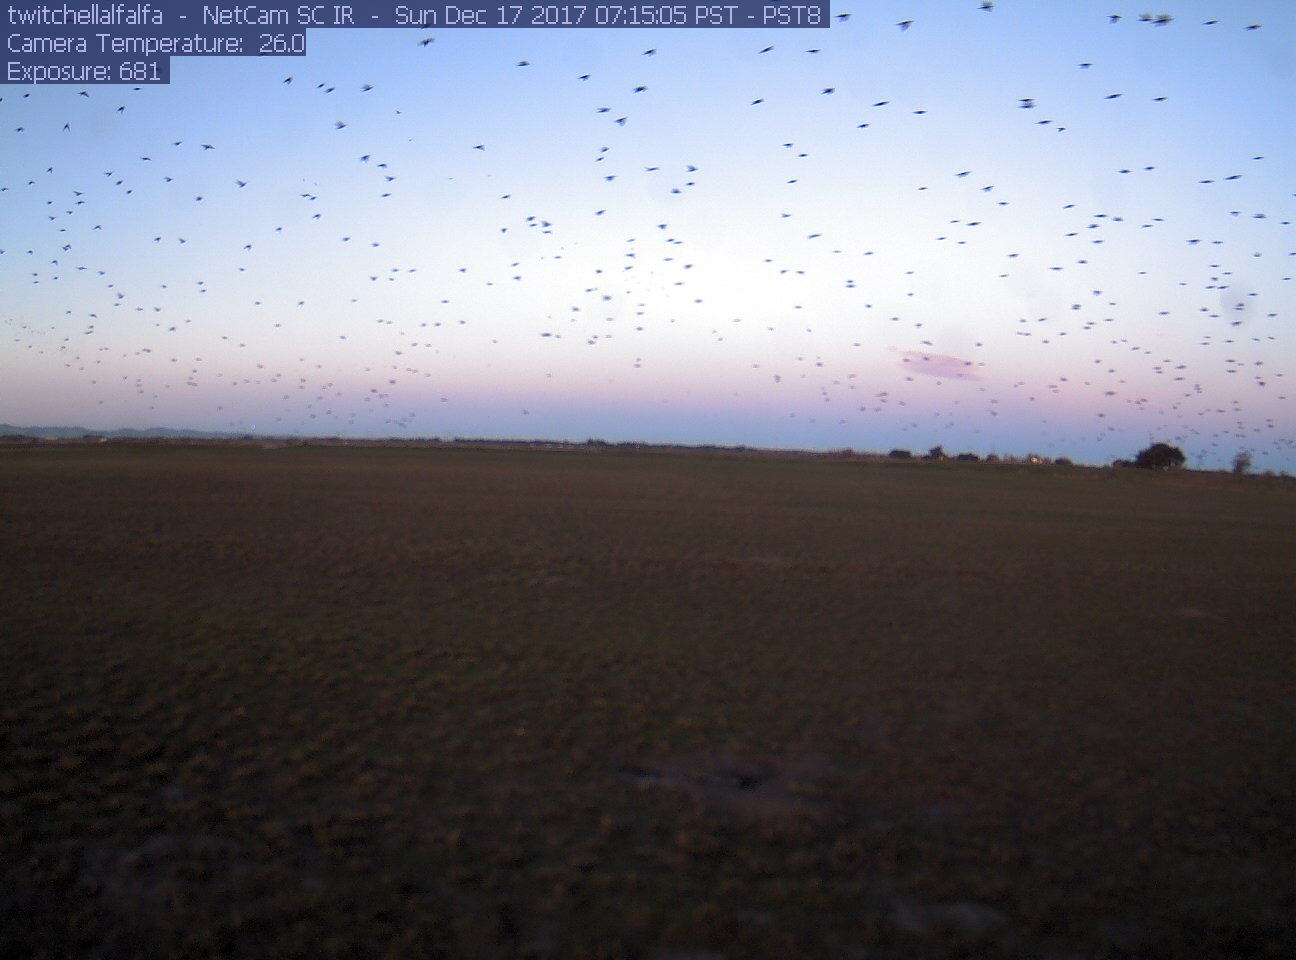
twitchellalfalfa_2017_12_17_071505.jpg ( 2017-12-17 07:17:00 ) Full size: 1296x960
Lots of birds

Graphs display:
7 sets found

Can't check TA_met
11 TA_met graphs found

Explore the graph:Alfalfa Temperatures in a new window

Explore the graph:Alfalfa Soil Heat Flux in a new window

Explore the graph:Alfalfa Soil Moisture in a new window

Explore the graph:Alfalfa Soil Temperatures Set A in a new window

Explore the graph:Alfalfa Soil Temperatures Set B in a new window

Explore the graph:Alfalfa Soil Temperatures Set C in a new window

Explore the graph:NDVI Narrow Band Radiation in a new window

Explore the graph:Soil CO2 Flux in a new window

Explore the graph:Relative Humidity and BattV in a new window

Explore the graph:SRS NDVI and PRI in a new window

Explore the graph:PRI Narrow Band Channels in a new window

Can't check TA_rad
3 TA_rad graphs found

Explore the graph:Alfalfa Radiation in a new window

Explore the graph:Alfalfa LED NDVI Sensor in a new window

Explore the graph:Alfalfa PAR in a new window

Can't check TA_flux
5 TA_flux graphs found

Explore the graph:Alfalfa Sonic Wind in a new window

Explore the graph:Alfalfa CO2 and H2O in a new window

Explore the graph:Alfalfa Methane in a new window

Explore the graph:Alfalfa Pressure in a new window

Explore the graph:Alfalfa Flux Data Counts in a new window

Can't check TA_soilco2
7 TA_soilco2 graphs found

Explore the graph:Set A Soil CO2 in a new window

Explore the graph:Set B Soil CO2 in a new window

Explore the graph:Soil CO2 Soil Moisture in a new window

Explore the graph:Forced Diffusion CO2 in a new window

Explore the graph:Alfalfa Forerunner Soil CO2 in a new window

Explore the graph:Alfalfa Forerunner Temperatures in a new window

Explore the graph:Alfalfa Forerunner Probe RH in a new window

1 TA_arable graphs found

Explore the graph:Temperatures in a new window

1 TA_cam graphs found

Explore the graph:GCC in a new window

Can't check TATWBABCSB_cam