Field Notes
<--2017-09-08 00:00:00 | 2017-09-26 09:00:00-->Other sites visited today: West Pond | Mayberry | East End
Phenocam link: Searching...
Sherman Wetland: 2017-09-13 13:25:00 (DOY 256)
Author: Daphne Szutu
Others: Elke Eichelmann, Sam Chamberlain
Summary: Regular data collection/cleaning, uploaded LI-7550 master configuration file
| 2017-09-13 Sherman Wetland We arrived at 13:25. It was sunny and very windy, as usual. The rain gauge was completely clogged with blackberry seeds; Sam cleaned it out. Elke refilled the wash reservoir; it was 4/5 full. Elke also cleaned the EC and radiation sensors. I downloaded met, camera, and USB GHG data. The Licor GHG data has been weirdly formatted, with extra columns of data and header/data don't quite match. There seems to be a problem with the LI-7550 configuration file. I downloaded the complete configuration, "sn2667_1569_SW-all_20170913.l7x". I uploaded a master configuration file to the LI-7550, "AIU-0674_MASTER_20170912.l7x". The master file was saved in the lab using LI-7550 AIU-0674 and had all fields except for zero/span values and calibration coefficients. I reset the box. I checked the pressure coefficients matched and renamed the site/station name. The numbers look ok. LI-7500 readings: -First column is with original configuration file, second column is with master configuration file CO2 386.8 --> 390.2 H2O 755 --> 728.1 T 22.1 --> 23.4 P 100.9 --> 101.3 SS 101 --> 106 after cleaning LI7700 readings: CH4: 1.93 RSSI: 48.0 -> 70.5 after cleaning We left around 13:45. |
1 photos found

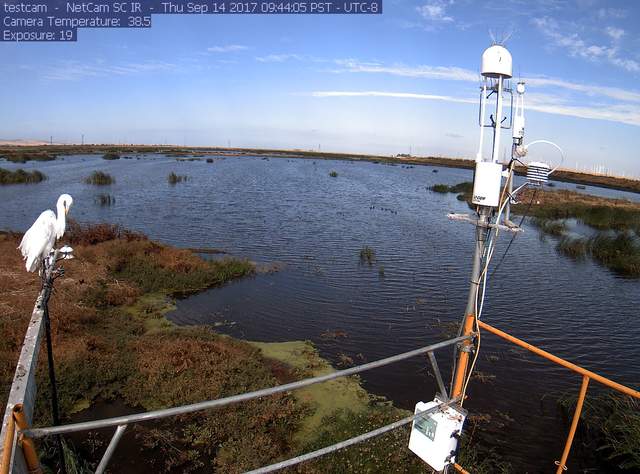
siwetland_2017_09_14_094405.jpg ( 2017-09-14 08:45:50 ) Full size: 1296x960
Egret on radiometer boom
7 sets found
Can't check MBWPEESWGT_mixed
Can't check MBEEWPSWEPGT_cam
15 SW_met graphs found
4 SW_flux graphs found
Can't check MBSWEEWPBCBA
Can't check SW_Temp
14 SW_Temp graphs found
No data found for SW_arable.

