
Field Notes
<--2017-05-25 14:25:00 | 2017-06-05 09:15:00-->Other sites visited today: Tonzi | Vaira | East End
Phenocam link: Searching...
Bouldin Corn: 2017-06-01 11:00:00 (DOY 152)
Author: Joe Verfaillie
Others: Daphne
Summary: Replaced power supply, cleaned Licors, looks like they are planting the field today.
| Bouldin 2017-06-01 I arrived about 11am with Daphne. It was clear sunny and mild with a breeze from the west. Tractors were working in the nearby fields. It looks like our field has been planted and the tractors were planting the surrounding fields. There are lots of weeds around the base of the tower. The first corn will be a couple of meters away. We should probably move the tower over closer to the corn when it comes up and pull the weeds around the tower. We replaced the dying lab power supply with a Gateway laptop 19V 2.64A power supply and a 12V 1.2A wall wart. The eddy stuff is connected to the 19V supply and the met stuff is on the 12V supply. There is a spare 19V supply in the box. Everything powered up and seemed to be running well. The gas analyzers were very dirty. The 7500 read: CO2 377.6ppm -> 412.3 after cleaning H2O 858.2mmol/m3 -> 598 after cleaning T 24.3C P 101.3kPa SS 82.0 -> 86 after cleaning – may (should) have been higher The 7700 read: CH4 1.41ppm -> 2.6ppm after cleaning RSSI 1.6 -> 70.0 after cleaning |
2 photos found

20170601BC_weeds.JPG ( 2017-06-01 11:37:46 ) Full size: 1920x1440
Weeds growing under the tower. Field has furrows but no sprouts yet.
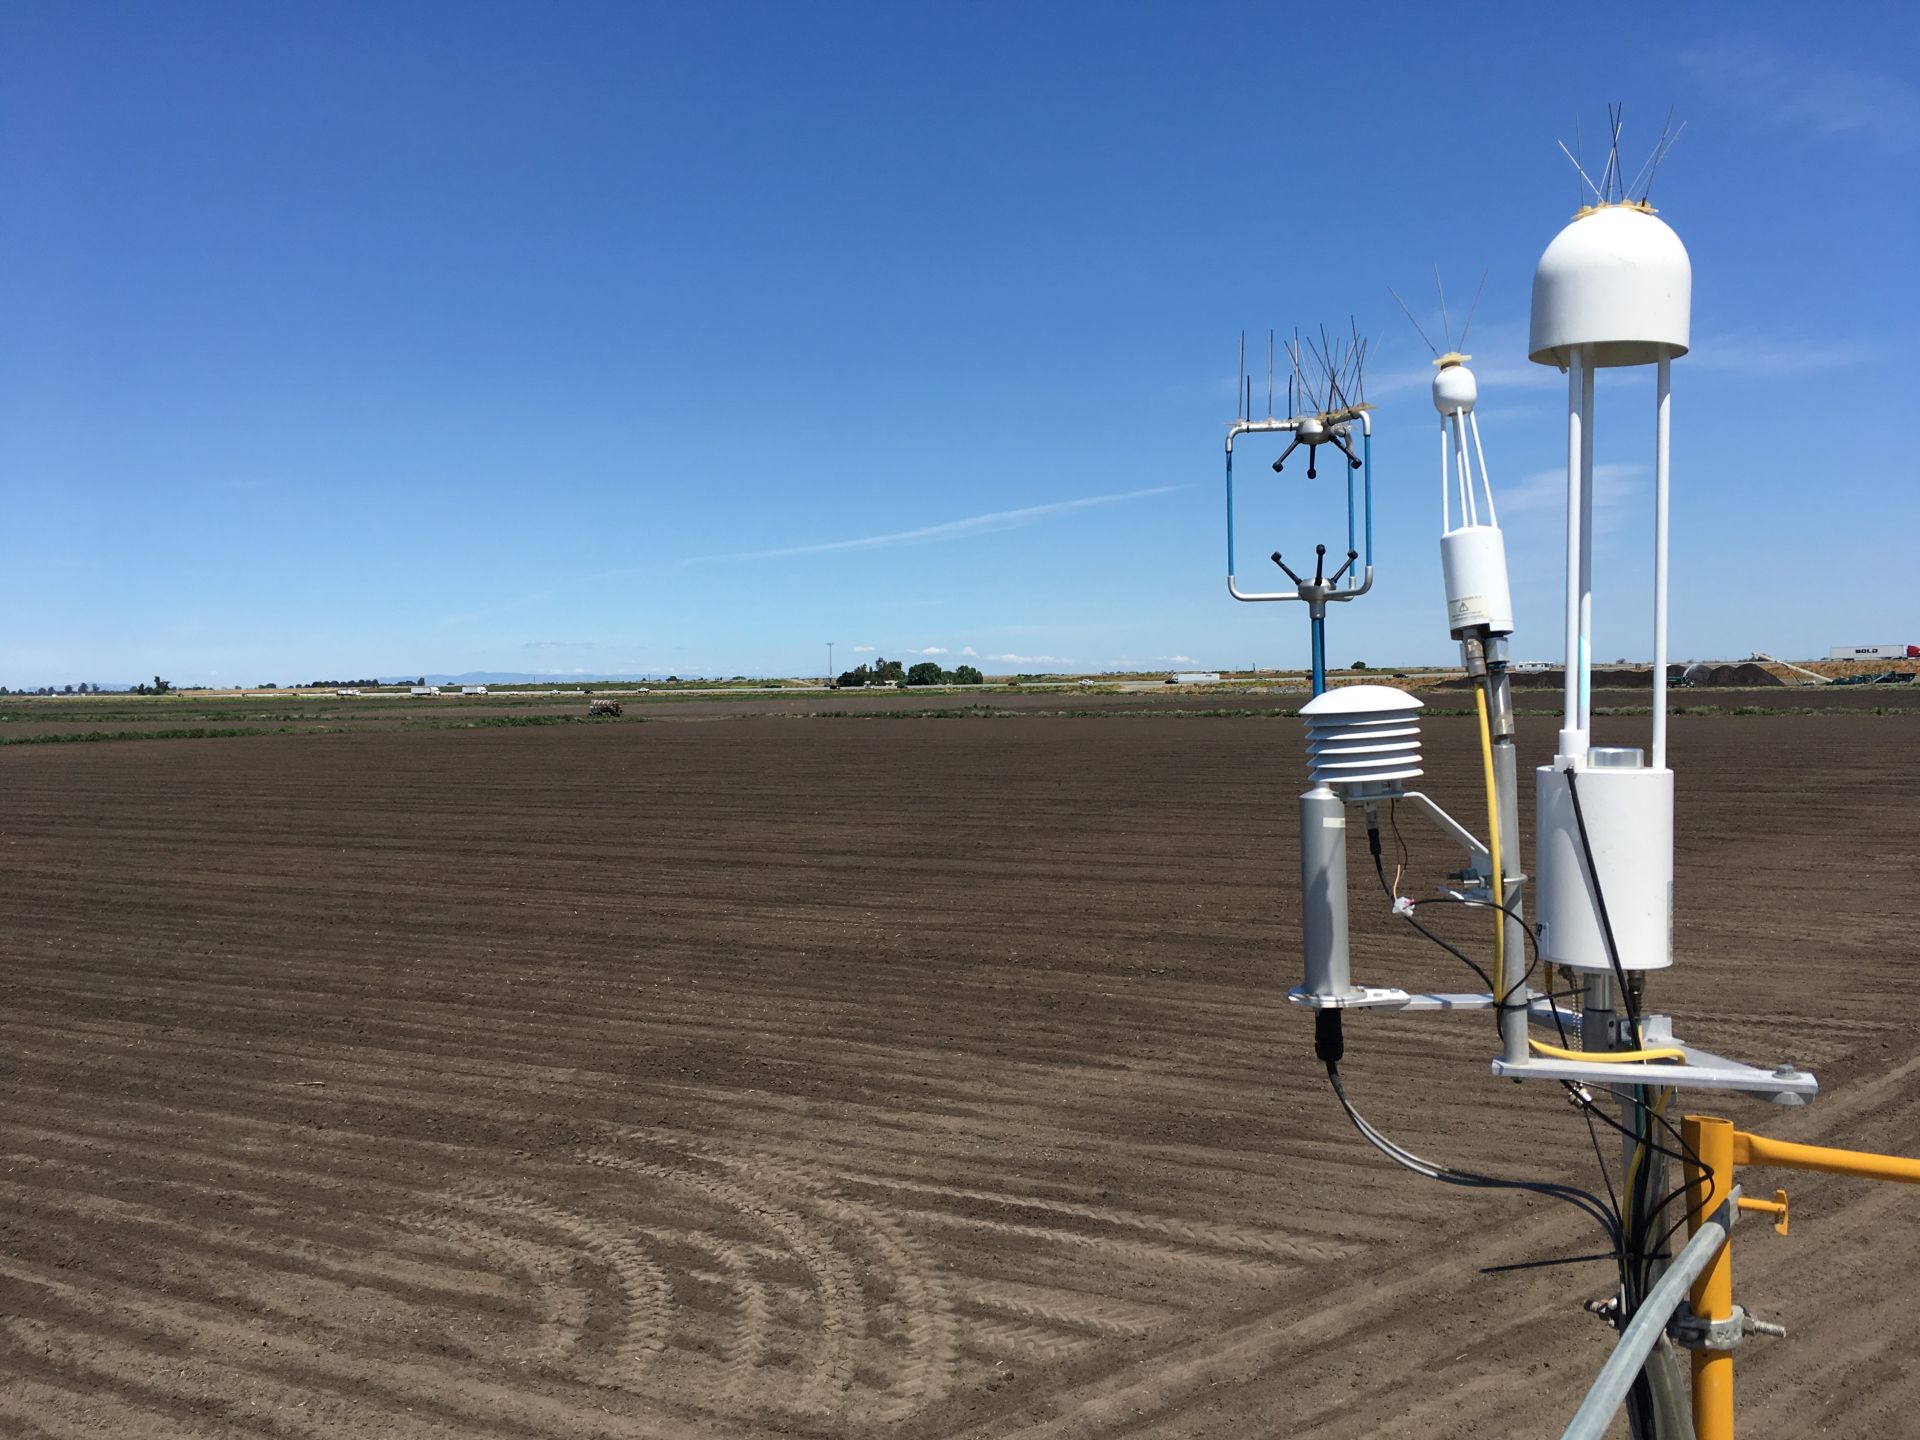
20170601BC_Field.jpg ( 2017-06-01 11:30:08 ) Full size: 1920x1440
Eddy sensors over a furrowed, bare field
6 sets found
17 BC_met graphs found
5 BC_flux graphs found
Can't check TATWBABCSB_cam
Can't check MBSWEEWPBCBA
No data found for BC_pa.
No data found for BC_arable.