Field Notes
<--2017-06-01 11:00:00 | 2017-06-23 12:00:00-->Other sites visited today: Bouldin Alfalfa | Twitchell Alfalfa | West Pond | East End | Mayberry
Phenocam link: Searching...
Bouldin Corn: 2017-06-05 09:15:00 (DOY 156)
Author: Joe Verfaillie
Others: Daphne
Summary: Collected data, corn coming up, swapped downward NDVI sensor, wash problem with 7700, pulled weeds.
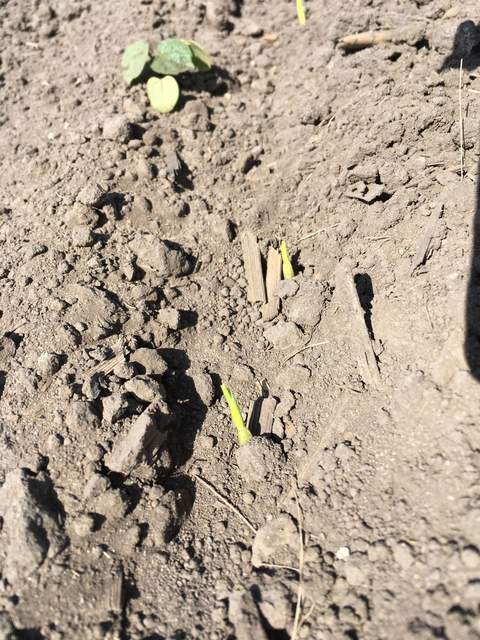
| Bouldin Corn 2017-06-05 I arrived about 9:15 with Daphne. It was breezy and mostly clear with some thin clouds. There is some corn coming up in surrounding fields. The norther third of our field has obvious spouts but directly in front of the tower you have to look closely to find a few sprouts breaking the surface. I pulled weeds in an area surrounding the tower and discovered a melon plant. I left the melon plant to grow. The 7700 reservoir was full but the RSSI was just under the wash threshold on 30%. We tried to manually run the mirror spin and pump but neither worked. There were no obvious problems with the wash box cable. The air pressure was also low. We collected the instrument configuration and some diagnostic data to send to Licor for troubleshooting. The CH4 ppm was high, but that might be due to the low pressure reading. I think the densities should be okay. The 7500 read: 414.1ppm CO2, 514.2mmol/m3 H2O, 20.5C, 101.4kPa, 86.1SS – 86.3 after cleaning The 7700 read: 2.59ppm CH4, 22.4C, 45.4kPa, 28.5RSSI – 76.5 after cleaning We swapped out the outgoing SRS NDVI sensor with field stops sn 943103015 for one with a hemispherical field of view sn 2046503357. After collecting the data, the met program was updated with a new SDI-12 address for the new sensor. The CR1000 battery voltage has been steady at 12.1V since replacing the power supply. We left at 10:10 |
1 photos found

20170605BC_Sprouts.jpg ( 2017-06-05 10:07:25 ) Full size: 1440x1920
Corn sprouts
6 sets found
17 BC_met graphs found
5 BC_flux graphs found
Can't check TATWBABCSB_cam
Can't check MBSWEEWPBCBA
No data found for BC_pa.
No data found for BC_arable.

