
Field Notes
<--2017-01-31 09:20:00 | 2017-02-14 13:32:00-->Other sites visited today: Tonzi | Bouldin Alfalfa
Phenocam link: Searching...
Twitchell Alfalfa: 2017-02-01 01:15:00 (DOY 32)
Author: Joe Verfaillie
Others:
Summary: Installed shunt to monitor solar power, new Decagon NDVI sensors, and replaced the rotating shadow band motor.
| Twitchell Alfalfa 2017-02-01 I arrived about 1:15pm. It was cold and foggy with a stiff breeze from the east. Sheep are on the field to the west again. The regular fieldwork was done here yesterday. I replaced the motor for the rotating shadow band. I added a DC shunt to the ground wire between the batteries and the solar charge controller. The voltage across the shunt should be 50mV at 500Amps. I connected it to channel 5 on the met CR1000 with a 7.5mV range. At max output from the solar panels (23A) we should see 2.3mV. The installation of the shunt shutdown all power for a few minutes. I also installed two Decagon SRS NDVI sensors on the radiation boom. Both sensors are hemispherical (opposed to field stop) sensors. sn 882103036 is SDI-12 id C and measuring incoming light and sn 882103061 is SDI-12 id E and measuring outgoing light. After collecting data from the CR1000 a new program was uploaded to read the two SRS NDVI sensors on the C7 port and the shunt voltage on Diff5. All the new data channels were added to the end of the met table. There was a bunch of water in the radiometer box the spilled out when I opened the door and condensation on the walls. Not sure how the water is getting in. |
1 photos found
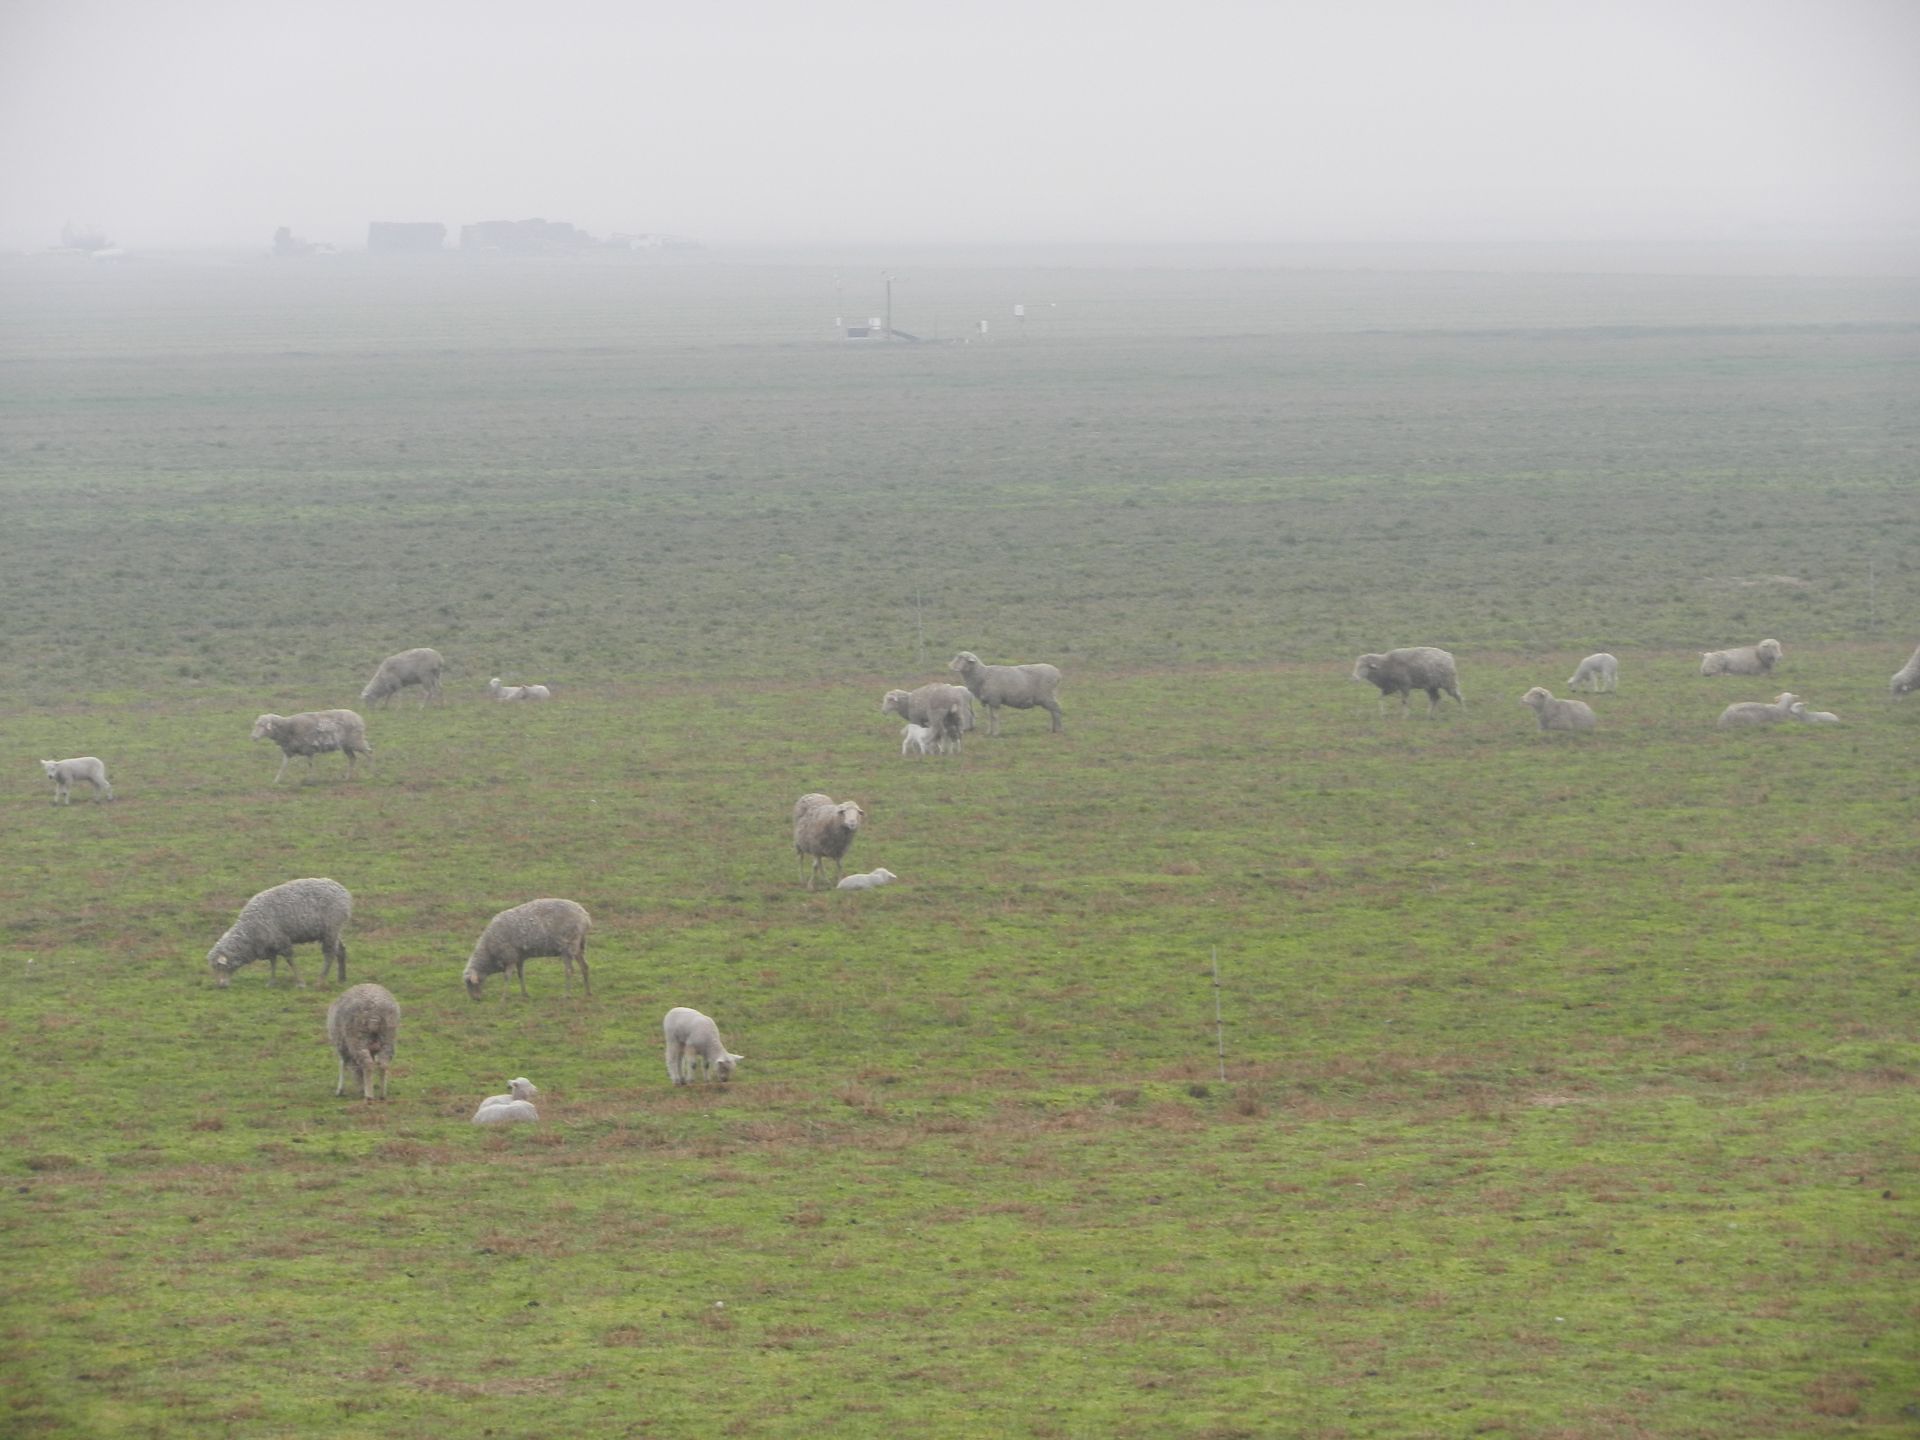
20170201TA_Sheep.jpg ( 2017-02-01 14:27:14 ) Full size: 1920x1440
Sheep on a foggy alfalfa field
7 sets found
Can't check TA_met
11 TA_met graphs found
Can't check TA_rad
3 TA_rad graphs found
Can't check TA_flux
5 TA_flux graphs found
Can't check TA_soilco2
7 TA_soilco2 graphs found
No data found for TA_arable.
1 TA_cam graphs found
Can't check TATWBABCSB_cam