Field Notes
<--2013-07-10 08:30:00 | 2013-07-26 14:10:00-->Other sites visited today: Mayberry | Twitchell Rice | West Pond | Twitchell Alfalfa | DWR Corn
Phenocam link: Searching...
Sherman Island: 2013-07-16 09:00:00 (DOY 197)
Author: Cove Sturtevant
Others: Sara, Yanel
Summary: Plant activity diminishing. Standard field measurements. Found 2 cm soil CO2 probe (profile A) partly out of soil - reinstalled. Took more instrument orientation measurements.
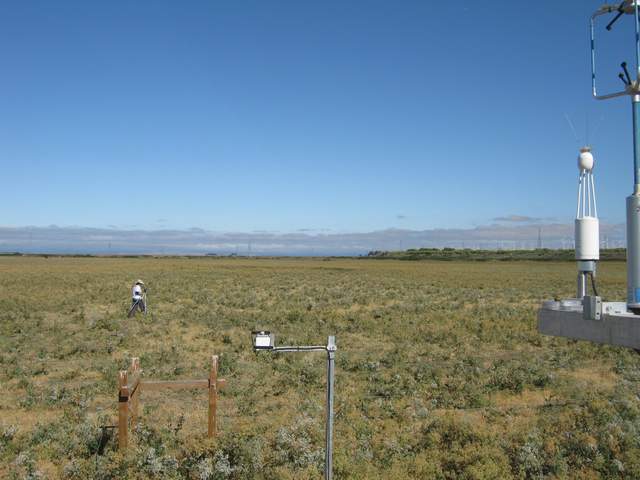
| Sherman 2013-07-16 We arrived about 09:00 PDT. It was sunny, windy, and cool (18 C). The field has certainly wilted a bit, the plants a duller green and partly tan with a full top of white flowers. I measured the general vegetation height at about 50 cm. I checked the tower while Yanel did spectral and Sara did soil CO2 flux and moisture point. I did well depth at the end. Sara reinstalled the 2 cm soil CO2 probe in profile A (the west profile) because it was partly out of the soil. I had a hard time deciphering the photos that Joe took of the sensor orientation, so I did a few more specific measurements. Height to middle of sonic: 3.2 m Sonic orientation (+x direction): 0 N (magnetic) Laterally from mid-sonic to mid-7500: 26 cm @ 280 N (magnetic) Laterally from mid-sonic to LGR inlet: 20 cm @ 90 N (magnetic) The ant traffic in the computer box was much less and the remaining ants were still visiting the ant baits. LGR readings: 1.90 ppm, 09:00, 25.4 C, 129.0 Torr (adjusted to 146 Torr), 10 Hz 7500 readings: CO2: 16.13 mmol m-3 (same after cleaning) H2O: 600 mmol m-3 (same after cleaning) diag: 248 p: 101.3 kPa t: 21.4 C sos = 343.7 m s-1 MET looked good. Soil CO2 looked good. |
1 photos found

SI_autocam_20130716_0815.jpg ( 2013-07-16 08:15:02 ) Full size: 1920x1440
Fieldwork
7 sets found
No data found for SI_mp.
11 SI_met graphs found
Can't check SI_mixed
2 SI_mixed graphs found
4 SI_flx graphs found
3 SI_soilco2 graphs found
Can't check TWSI_mixed
Can't check SIMBTWEE_met

