Field Notes
<--2013-02-28 13:15:00 | 2013-03-21 12:10:00-->Other sites visited today: Sherman Island | Mayberry | West Pond | DWR Corn
Phenocam link: Searching...
Twitchell Rice: 2013-03-14 12:20:00 (DOY 73)
Author: Cove Sturtevant
Others: Dennis, Sara, Suzy
Summary: Field has been disked. Pulled ground sensors & rotated boom. Adjusted 7550 clock back to standard time. Removed Date/Time fields from GHG output. Ants in solar controller. Pyranometer needs desiccant.
| Twitchell
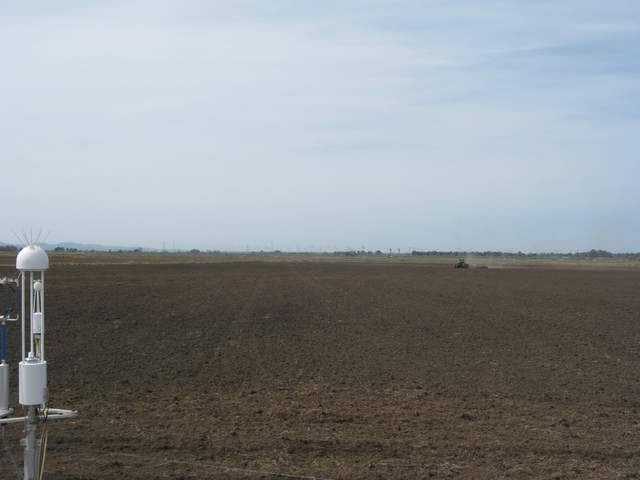
2013-03-14 We arrived at approximately 12:20 PDT. It was warm (~19 °C) and hazy with a mild breeze. The field is fully drained and has been disked except for an area where the ground sensors were (1 Campbell moisture probe was chopped). I downloaded data while Dennis, Sara, and Suzy pulled the remaining ground sensors and rotated the radiation boom inward. 7500 readings: CO2 = 393 ppm H2O = 605 mmol m-3 (700 after cleaning) agc = 32 (after cleaning it was 23.8) p = 102.1 kPa 7700 readings: CH4 = 2.01 ppm RSSI = 45 (bumped to 66 after cleaning) The reservoir was full. MET looked good. I also adjusted the clock on the 7550 back one hour to keep the clock in standard time (daylight savings “spring forward” was last weekend). Time change from 12:24 pm to 11:24 am. I also removed the Date and Time outputs of the data stream since this information is already included in the Seconds and Nanoseconds fields. There is ant activity in the solar controller. We need to bring ant bates next time. We also need to bring more desiccant for the pyranometer. Dennis started the portable tower truck and it started up like a charm. |
1 photos found

TW_autocam_20130315_1145.jpg ( 2013-03-15 11:45:03 ) Full size: 1920x1440
Tractor in the field
6 sets found
12 TW_met graphs found
5 TW_flux graphs found
Can't check TWSI_mixed
Can't check SIMBTWEE_met
1 TW_cam graphs found
Can't check TATWBABCSB_cam

