
Field Notes
<--2013-02-28 10:40:00 | 2013-03-21 11:00:00-->Other sites visited today: Sherman Island | Twitchell Rice | West Pond | DWR Corn
Phenocam link: Searching...
Mayberry: 2013-03-14 10:40:00 (DOY 73)
Author: Cove Sturtevant
Others: Dennis, Sara, Suzy
Summary: Water level low. CO2 probes out of water. Reinstalled lower DO probe. Line lock on 7700 lost again. No data collection from 7700. Reset all and currently collecting okay. Return next week for check. Adjusted clock on 7700 back to standard time.
| Mayberry
2013-03-14 Permanent tower We arrived about 10:40 PDT. There was a hazy high cloud layer and it was warm and breezy. The site remains senescent with a lot of cottony cattail material covering everything. Dennis and I attended to the tower and downloaded data while Sara and Suzy went out into the water to install the lower DO probe (#7 – 40 cm below surface), which showed good readings thereafter. 7500 readings: CO2: 410 ppm H2O: 680 mmol m-3 agc: 35.6 variable due to cattail material in path (adjusted to 32.0) Current 7700 readings: CH4 = 0 ppm (no line lock), 2.07 ppm after reset RSSI = 44, 76 after cleaning The reservoir was full. The line-lock on the 7700 was lost (again) when I checked the instrument. This has been the case for the previous 2 weeks which I thought I had fixed last week upon finding a loose power connection at the 7700. After resetting the line lock (it was stable thereafter), Dennis and I tightened all connections (not just power). We should come out next week with a replacement if the line lock is lost again. Line lock notwithstanding, there was no data collection from the 7700. When I looked in some of the files to determine when the line lock was lost, all 7700 data was reading -9999 since 2 weeks ago. This was a result of the “data not synchronized” warning I dismissed last week. I thought it was a minor warning since 7550 and 7700 clocks all had the correct settings and were changing in tandem. Obviously, this warning is not really a warning, it means no 7700 data is being collected. Rebooting all instruments fixed this and a check of the new files collected on the USB stick confirmed good data collection. We shall see how long the line lock lasts. I also adjusted the clock on the 7550 back one hour to keep the clock in standard time (daylight savings “spring forward” was last weekend). Time change from 11:09 am to 10:09 am. We should bring a spare set screw for the camera boom. MET looked good. Some notes from Sara: The water level was low. The tule CO2 probe and associated thermocouple were out of the PVC tube and floating. Reinserted. DO probe was lowered into the water. Cleaned surface DO and CO2 probe in channel. The CO2 probe thermocouple was also floating. Reattached. Cleaned radiation sensors which were covered in spider webs and cattail junk. |
2 photos found

MB_autocam_20130314_1045.jpg ( 2013-03-14 10:45:02 ) Full size: 1920x1440
Dennis on site
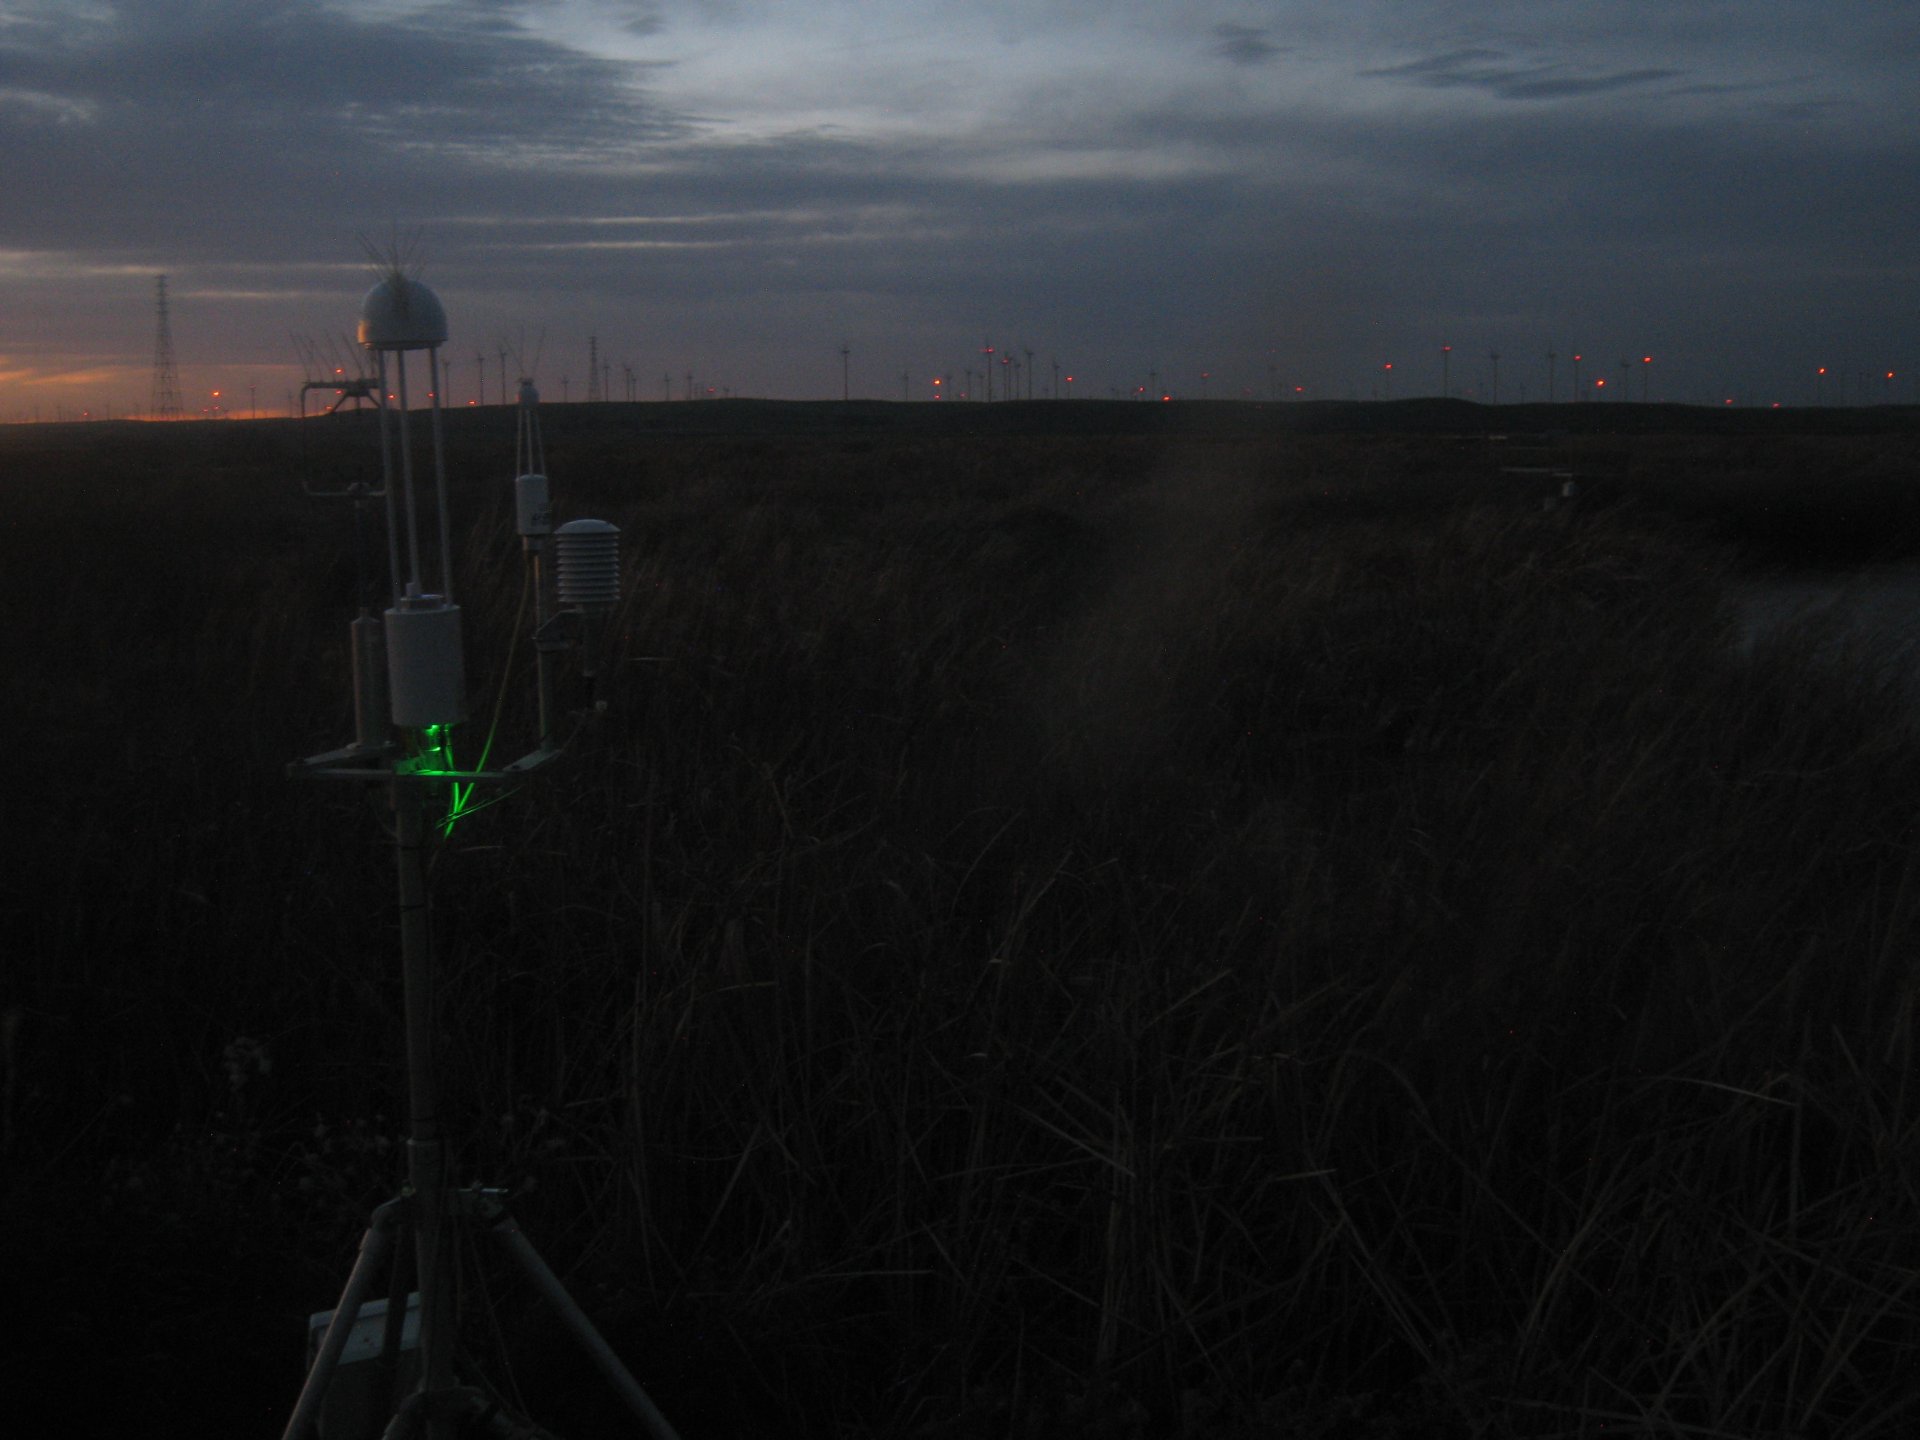
MB_autocam_20130315_1945.jpg ( 2013-03-15 19:45:05 ) Full size: 1920x1440
Nice light
11 sets found
7 MB_flux graphs found
No data found for MB_met.
28 MB_tule graphs found
Can't check MBWPEESWGT_mixed
1 MB_cam graphs found
Can't check MBEEWPSWEPGT_cam
Can't check SIMBTWEE_met
No data found for MB_minidot.
Can't check MBSWEEWPBCBA
1 MB_processed graphs found
Can't check MB_fd
1 MB_fd graphs found