Field Notes
<--2013-02-28 09:30:00 | 2013-03-21 09:30:00-->Other sites visited today: Mayberry | Twitchell Rice | West Pond | DWR Corn
Phenocam link: Searching...
Sherman Island: 2013-03-14 09:30:00 (DOY 73)
Author: Cove Sturtevant
Others: Dennis, Sara, Suzy
Summary: Suzy visiting from JGI. Swapped out LGR. Regular field work. Dennis almost got eaten. All else well.
| Sherman
2013-03-14 We arrived about 09:30 PDT. It was hazy and cool, 14 °C, with a steady breeze. The site remains consistent with a very short green grass layer with intermixed bare ground. The ground under the bridge on the way in was cracked and dry, and the water in the ditches was very low. Suzy (sp?) from the Joint Genome Institute was with us checking out the sites today and we had a grand time getting to know her and hear about her research. Dennis and I downloaded data and swapped out the LGR (I forgot to grab the serial #s of the swaps… next time) while Sara and Suzy took moisture point, well depth, soil CO2 flux, and spectral. Dennis cleaned all the sensors and narrowly averted a Black Widow bite when picking up the LGR to take back to the car. 4 inches lower with his grip and he would have been toast! LGR readings before the swap: 7:31, 23.75 °C, 136.8 Torr, 13.81 us, 10 Hz, 2.13 ppm LGR readings after the swap: 9:15, 18.78 °C, 141.7 Torr, 16.86 us, 10 Hz, 2.06 ppm 7500 readings: CO2: 18.7 mmol m-3 H2O: 579 mmol m-3 diag: 248 sos = 342 m s-1 p = 102.06 kPa MET looked good. We should think about replacing some of the bad thermocouples out here, namely TC2_8 and TC3_32 which have both been reading –INF since I can remember. We also need new (clean) rags for the 7500 and 7700 mirror cleaning. |
1 photos found

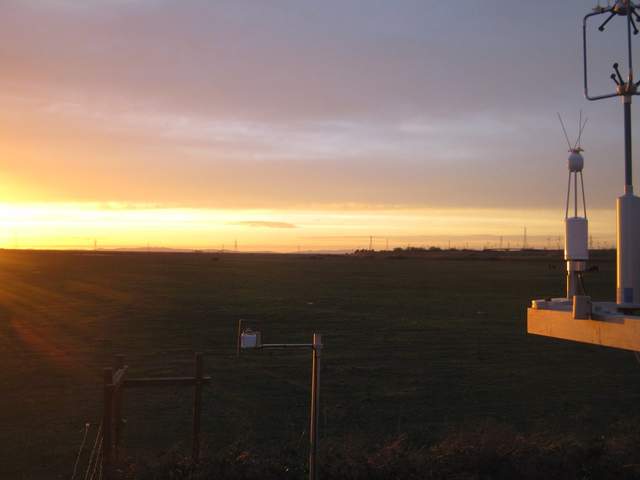
SI_autocam_20130314_1815.jpg ( 2013-03-14 18:15:03 ) Full size: 1920x1440
Nice sunset
7 sets found
No data found for SI_mp.
11 SI_met graphs found
Can't check SI_mixed
2 SI_mixed graphs found
4 SI_flx graphs found
3 SI_soilco2 graphs found
Can't check TWSI_mixed
Can't check SIMBTWEE_met

