Field Notes
<--2012-12-06 13:10:00 | 2013-01-03 11:20:00-->Other sites visited today: Mayberry | Twitchell Rice | West Pond | DWR Corn
Phenocam link: Searching...
Sherman Island: 2012-12-14 09:30:00 (DOY 349)
Author: Cove Sturtevant
Others: Laurie
Summary: Standard field work, downloaded data, ants in the big box.
| Sherman
2012-12-14 We arrived about 09:30 PST. It was cold, about 6 °C, with a very mild breeze and cloudy. The field was slightly mucky with more bare spots due to significant cow trampling, although the short green grass layer largely remains. Laurie did soil respiration, well depth, and moisture point, and I did spectral later on. I checked the tower, downloaded the data & autocam pics, and cleaned the instruments (including radiation sensors). We brought a replacement radiation shield with new fan for the Vaisala T/RH sensor, but the current fan was still humming so I did not replace. There is a steady stream of ants into the wooden box, and they seem to really like the power conduit on the LGR pump. No serious problems as of yet, but we need to bring ant baits next time we’re out. LGR readings: 08:27, 22.78 °C, 134.9 Torr (adjusted to 145.7 Torr), 13.84 us, 10 Hz, 2.53 ppm 7500 readings: CO2: 18.2 mmol m-3 H2O: 360 mmol m-3 diag: 247 p = 101.3 kPa t = 8.8 °C MET & Soil CO2 data looked good. |
2 photos found

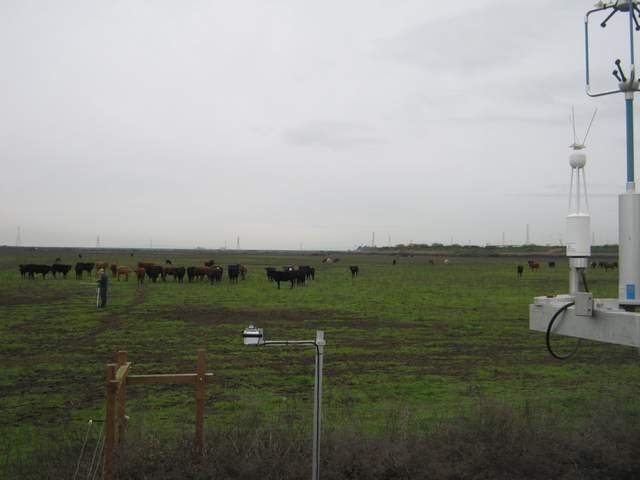
SI_autocam_20121214_1015.jpg ( 2012-12-14 10:15:03 ) Full size: 1920x1440
Cove showing the cows how to take spectral measurements

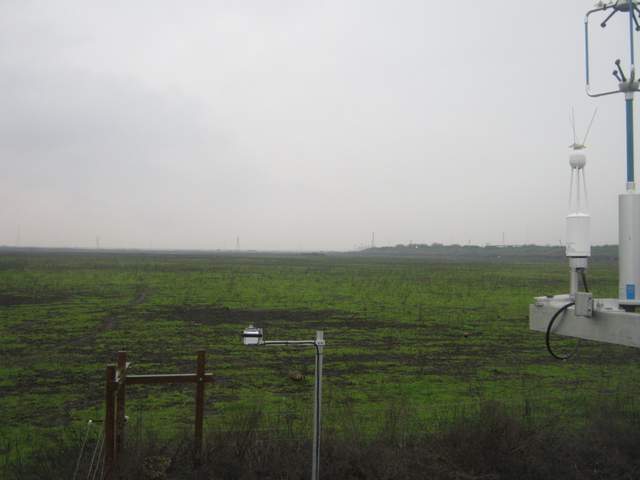
SI_autocam_20121215_1515.jpg ( 2012-12-15 15:15:02 ) Full size: 1920x1440
Ring necked pheasant on a gray day at the cow pasture
7 sets found
No data found for SI_mp.
11 SI_met graphs found
Can't check SI_mixed
2 SI_mixed graphs found
4 SI_flx graphs found
3 SI_soilco2 graphs found
Can't check TWSI_mixed
Can't check SIMBTWEE_met

