
Field Notes
<--2012-11-08 10:15:00 | 2012-11-29 12:45:00-->Other sites visited today: Vaira | Tonzi | Sherman Island | Twitchell Rice | West Pond | DWR Corn
Phenocam link: Searching...
Mayberry: 2012-11-15 14:50:00 (DOY 320)
Author: Cove Sturtevant
Others: Laurie
Summary: Licor GHG clock behind by one hour - DST, lowered DO, and CO2 probes.
| Mayberry
2012-11-15 Permanent tower We arrived about 14:50 PST. It was cloudy and calm, about 16°C. I checked the tower while Laurie cleaned the instruments. Current 7700 readings: CH4 = 2.5 ppm RSSI = 60 7500 readings: CO2: 416 ppm H2O: 400 mmol m-3 agc: 43.8 The clock on the 7550 was an hour off. I’m not sure if the 7550 adjusts for daylight savings time (couldn’t find anything in the manual), but I found that all the 7550 clocks are behind by about an hour compared to the MET dataloggers. Perhaps the 7550 thought the time was in PDT previously, and adjusted it to PST on Nov 4. I changed the 7550 clock to the correct PST time to match the 23x time at 13:51 PST. We should take a look at the data pre- and post- Nov 4 to make sure the MET and flux data are aligned in processing. Or has someone seen this before? Laurie and I headed out into the water and she took water samples while I checked the MET data. We have not been able to connect with the 23x from the tower since a few weeks ago, so I think the cable or connection is bad in some way (although Joe with his magic touch reportedly connected a couple weeks ago). This isn’t an urgent issue since we can just go out to the 23x and hook right in, but we should fix it one of these days, maybe after the magic guru touch no longer works. MET data looked fine. I lowered the surface DO and CO2 probes in both the channel and the tules to about 10 cm below the surface. I had to lower them about 5 cm in the tules but only about 2 cm in the channel. I also gently wiped off the membranes of the DO probes to remove algae. |
2 photos found
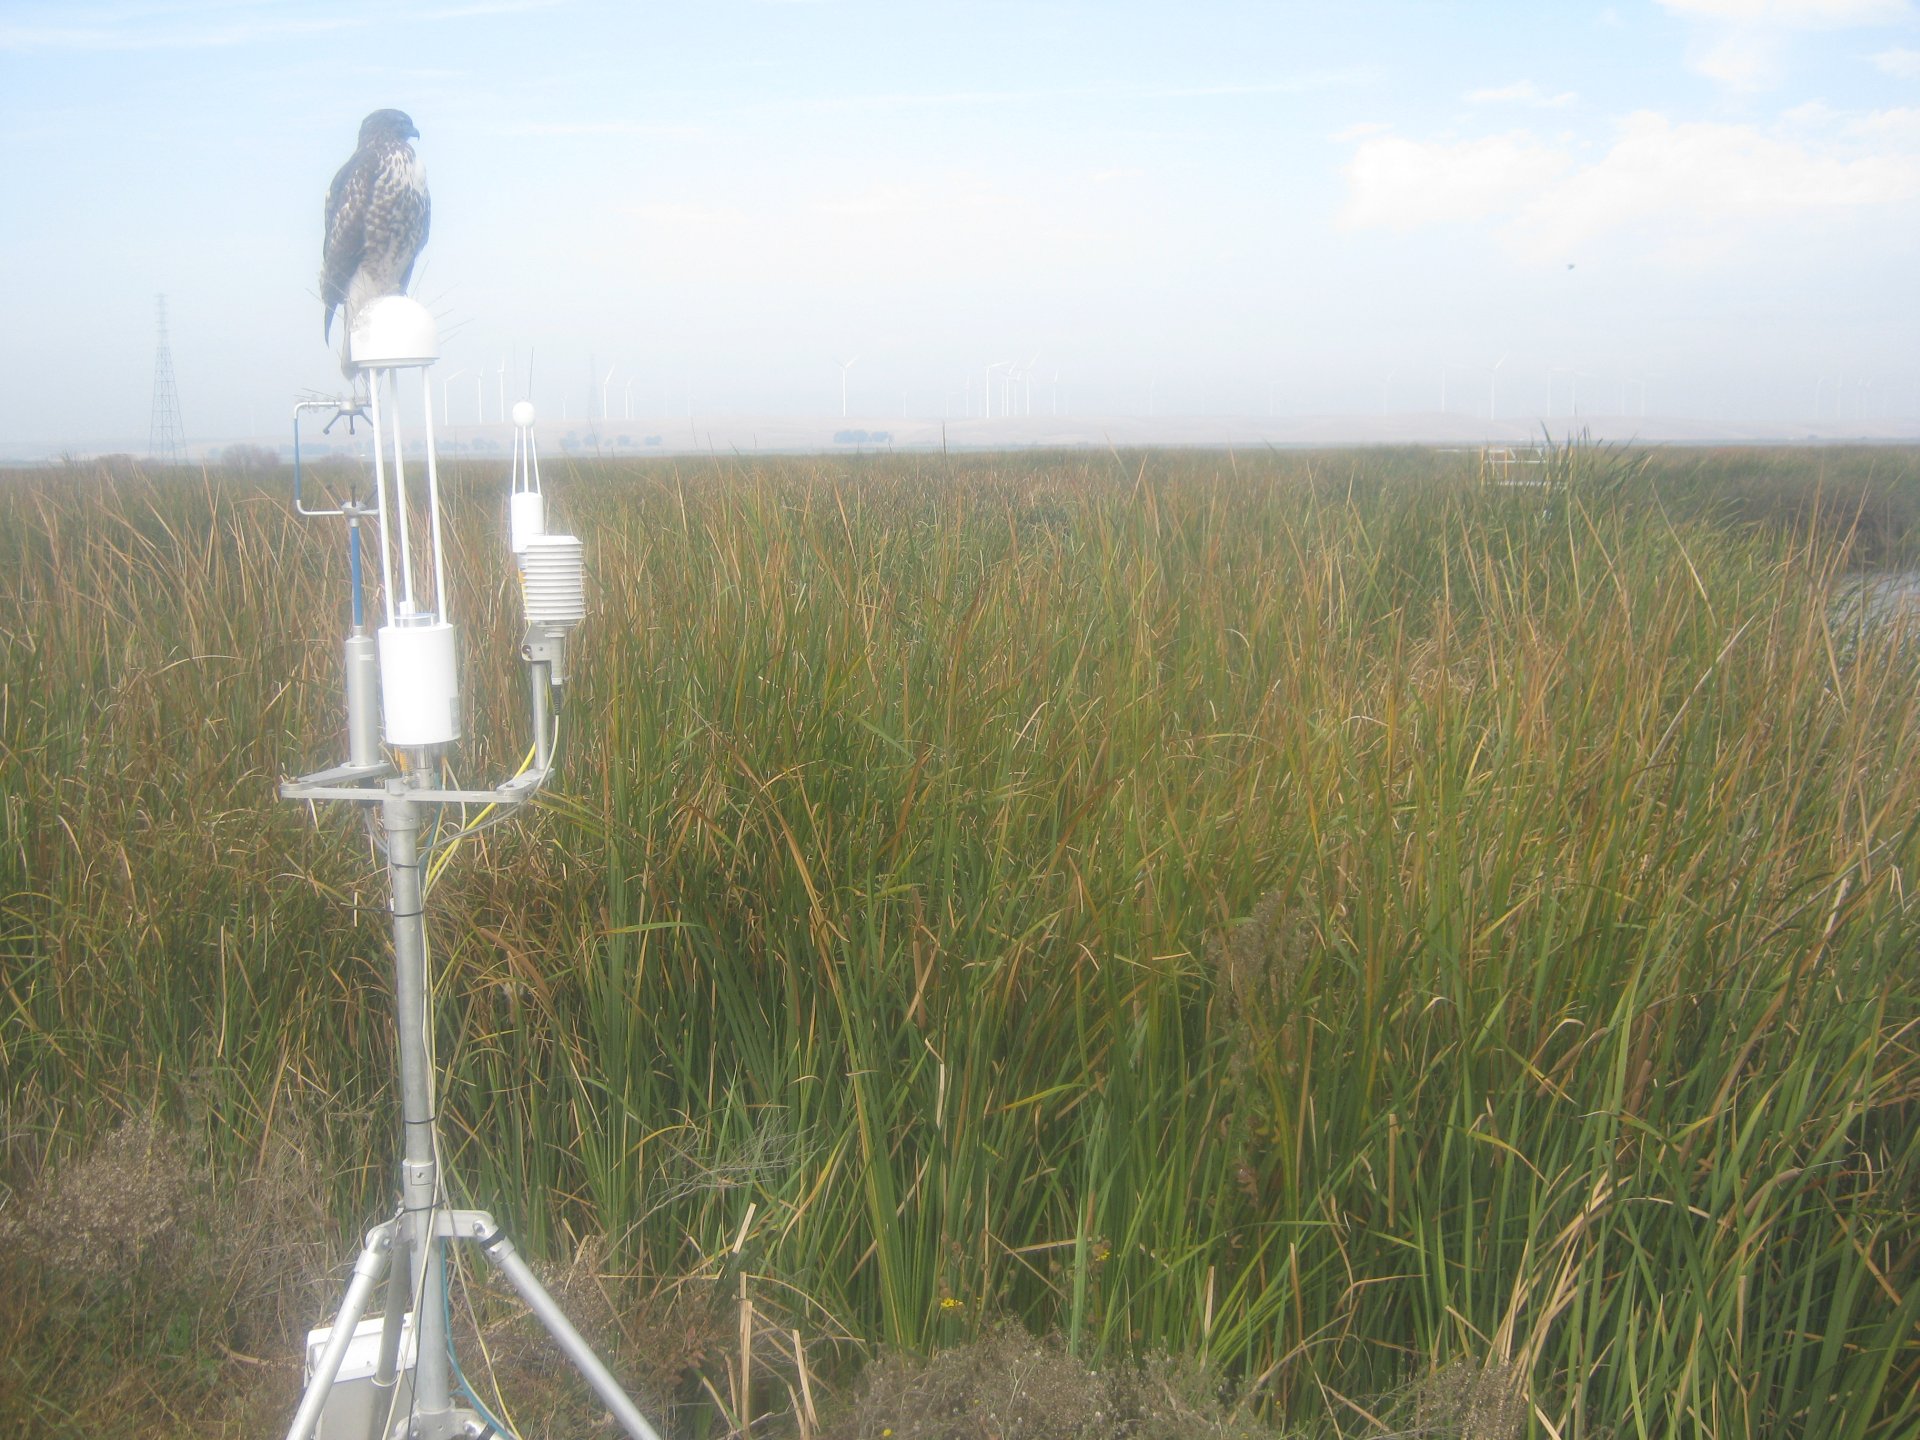
MB_autocam_20121115_1145.jpg ( 2012-11-15 11:45:02 ) Full size: 1920x1440
Hawk on 7700
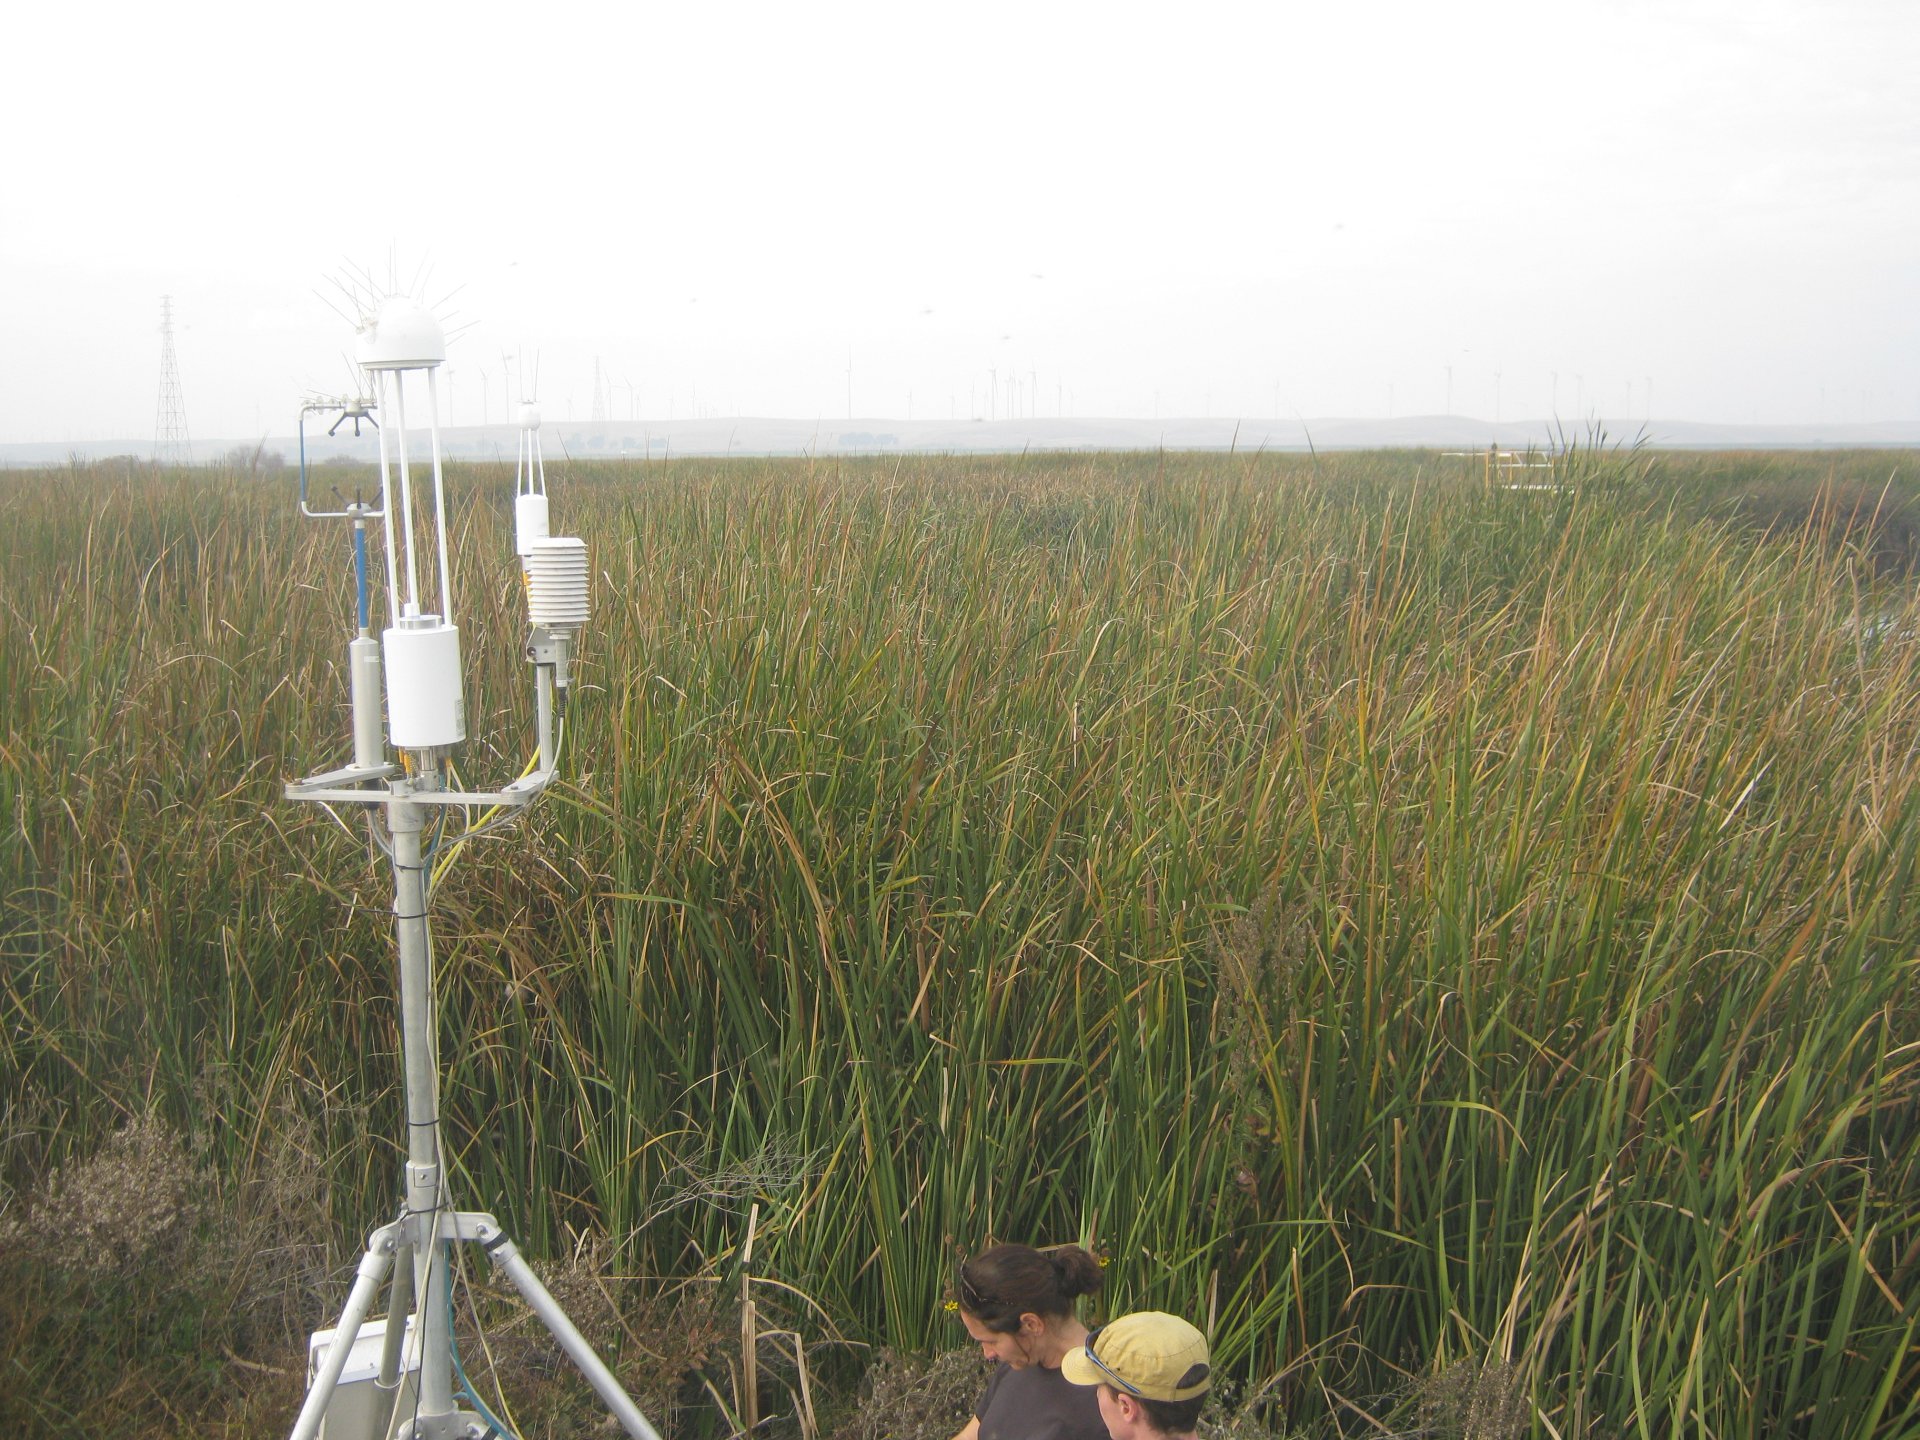
MB_autocam_20121115_1545.jpg ( 2012-11-15 15:45:02 ) Full size: 1920x1440
Field work
11 sets found
7 MB_flux graphs found
No data found for MB_met.
28 MB_tule graphs found
Can't check MBWPEESWGT_mixed
1 MB_cam graphs found
Can't check MBEEWPSWEPGT_cam
Can't check SIMBTWEE_met
No data found for MB_minidot.
Can't check MBSWEEWPBCBA
1 MB_processed graphs found
Can't check MB_fd
1 MB_fd graphs found