
Field Notes
<--2012-11-08 11:45:00 | 2012-11-29 10:00:00-->Other sites visited today: Vaira | Tonzi | Sherman Island | Mayberry | West Pond | DWR Corn
Phenocam link: Searching...
Twitchell Rice: 2012-11-15 09:45:00 (DOY 320)
Author: Cove Sturtevant
Others: Laurie
Summary: Rice has been harvested and chopping is in progress, Licor GHG clock 1 hour behind
| Twitchell
2012-11-15 We arrived at approximately 09:45 PST. It was calm and partly cloudy, about 11 °C. We came to Twitchell early because we forgot the keys to get into Sherman/Mayberry and planned to return there later. The rice has been harvested. All the tops of the plants are missing and they are currently in the process of mowing it down to nubs. Most of the LAI/spectral transect has been mown. Laurie did spectral while I checked the tower. Current 7500 readings: CO2 = 493 ppm after cleaning H2O = 490 mmol m-3 after cleaning agc = 75 (37.5 after cleaning) 7700 readings: CH4 = 3.0 ppm RSSI = ~7 variable (bumped to 66 after cleaning) There were lots of dew-laden spider webs in the paths of both the 7500 and 7700. I cleaned a little house by knocking out the >10 freeloading spiders inhabiting the 7700 radiation shield. Hopefully this cuts down on the web activity for a while. I also cleaned the radiation sensors and the solar panels. The clock of the 7550 was 1 hour and 2 minutes behind the MET datalogger, perhaps due to automatic adjustment for the end of daylight savings time in the 7550. I adjusted the 7550 clock to match the datalogger at 11:36 PST. We should check the data streams to ensure MET and flux are time-consistent. MET values looked fine considering they are gathered around the tower. |
7 photos found
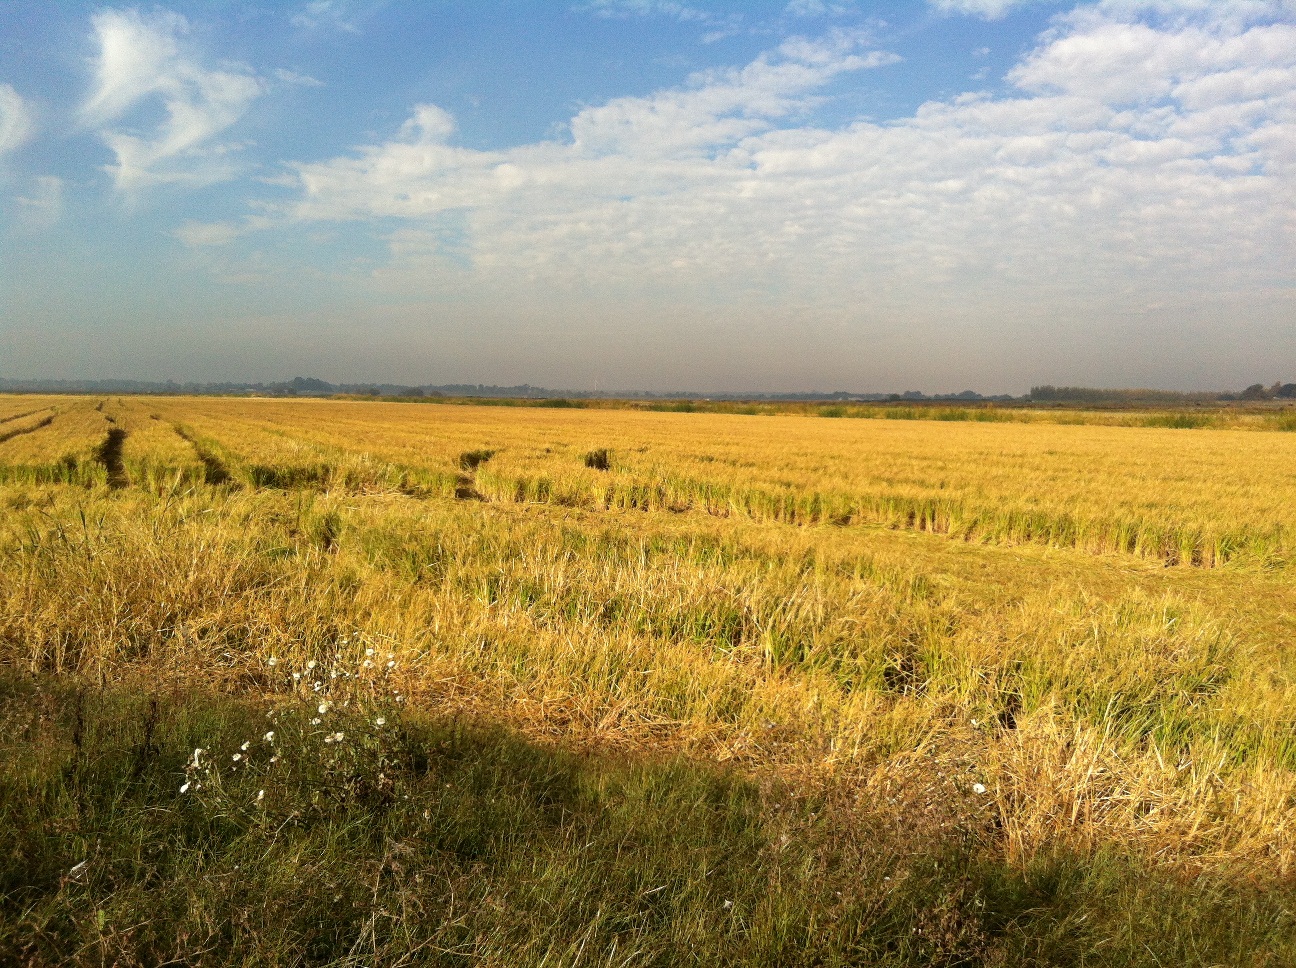
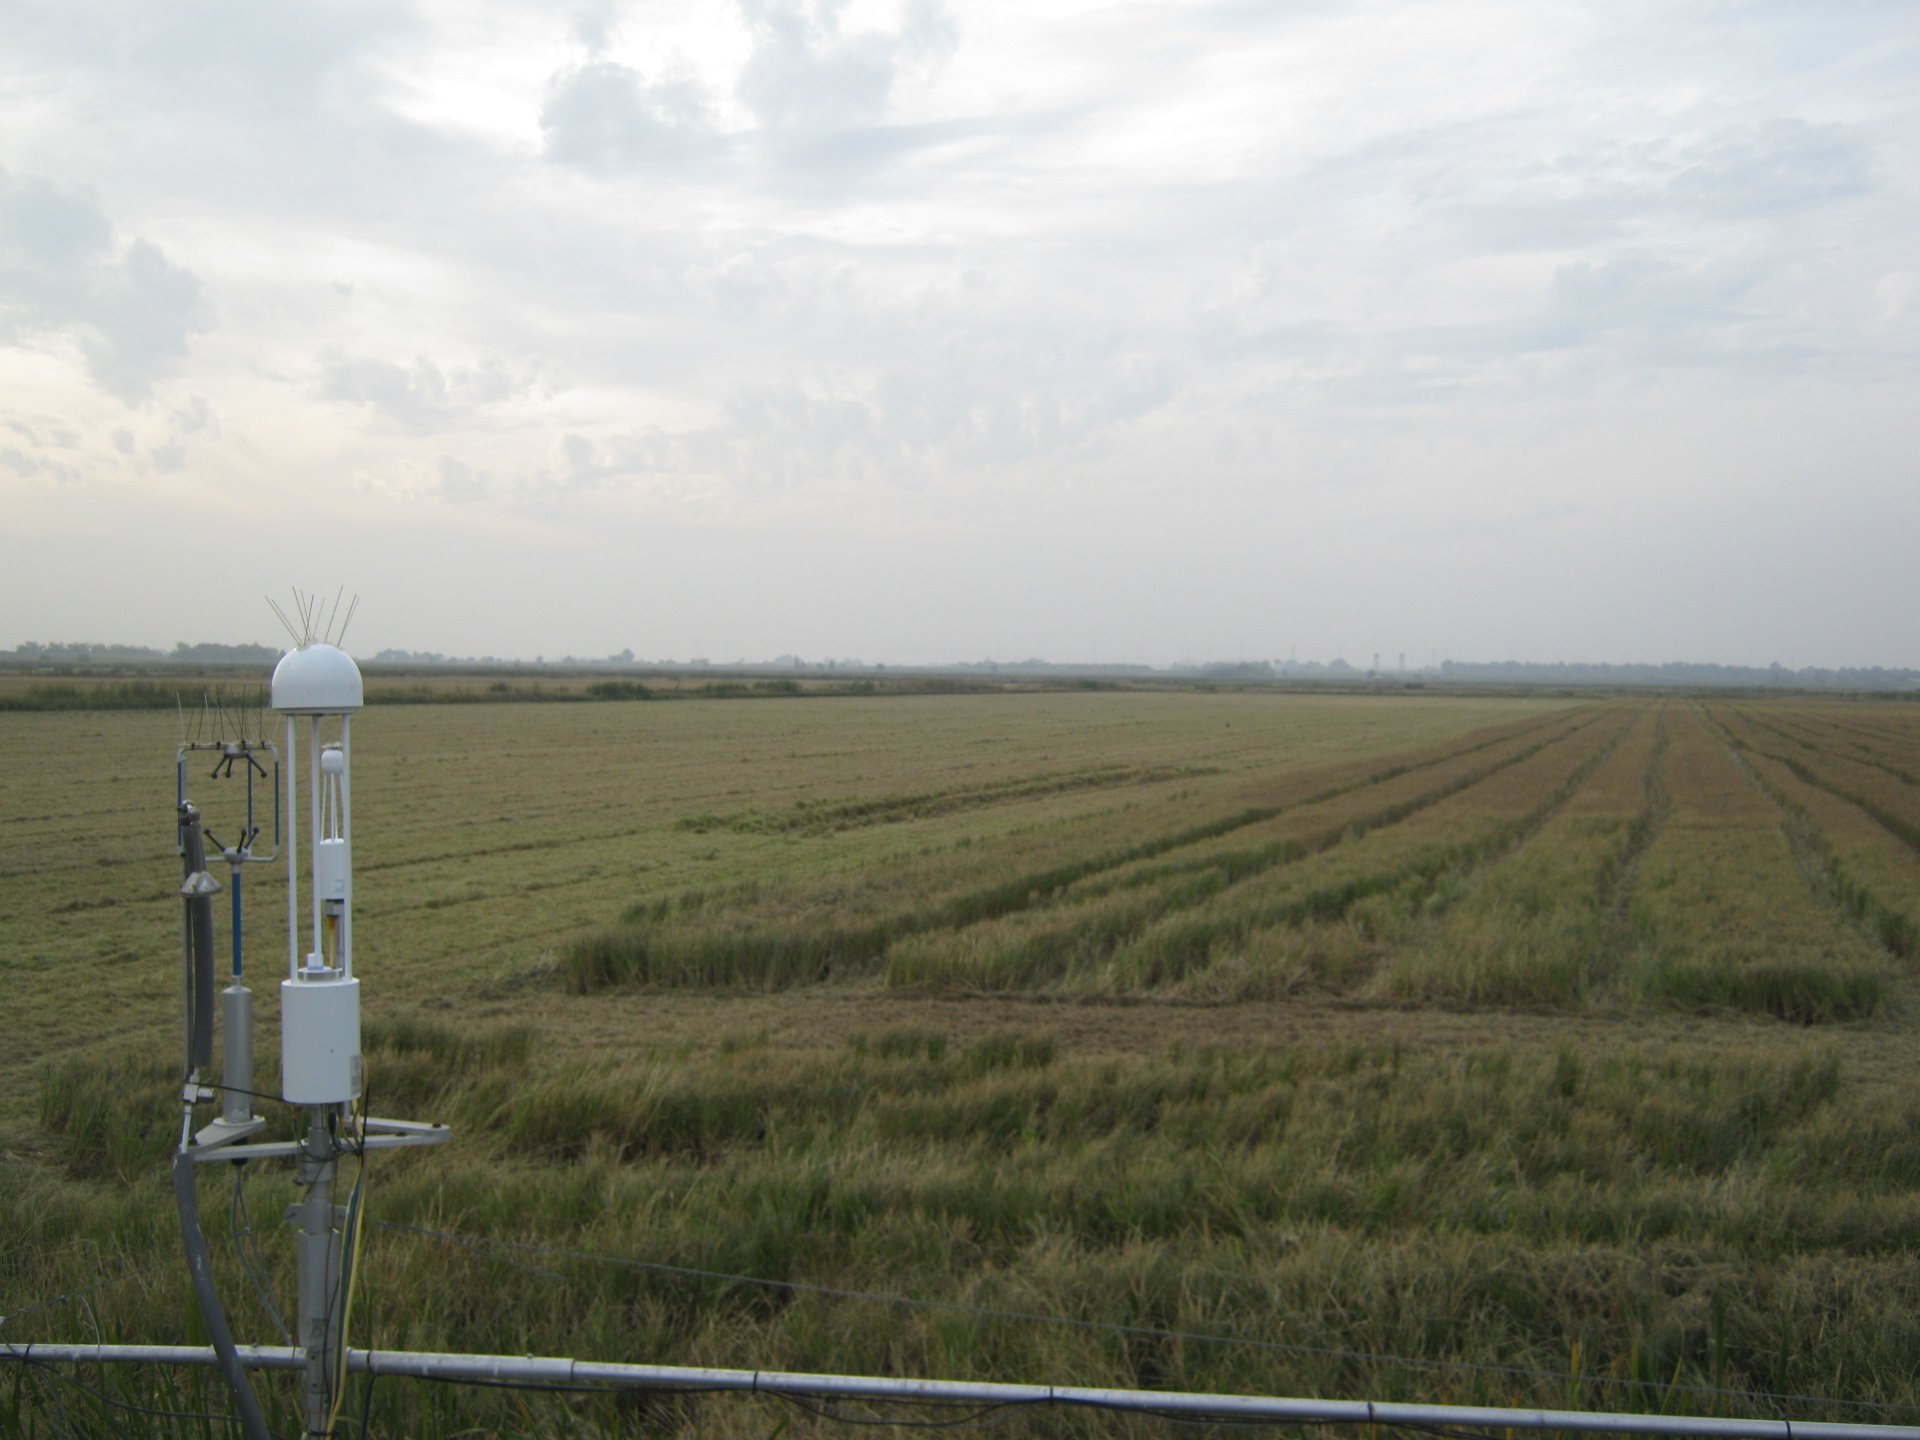
20121115TW_shaved_mowed.jpg ( 2012-11-15 09:42:35 ) Full size: 1296x968
Morning light on the harvested rice field
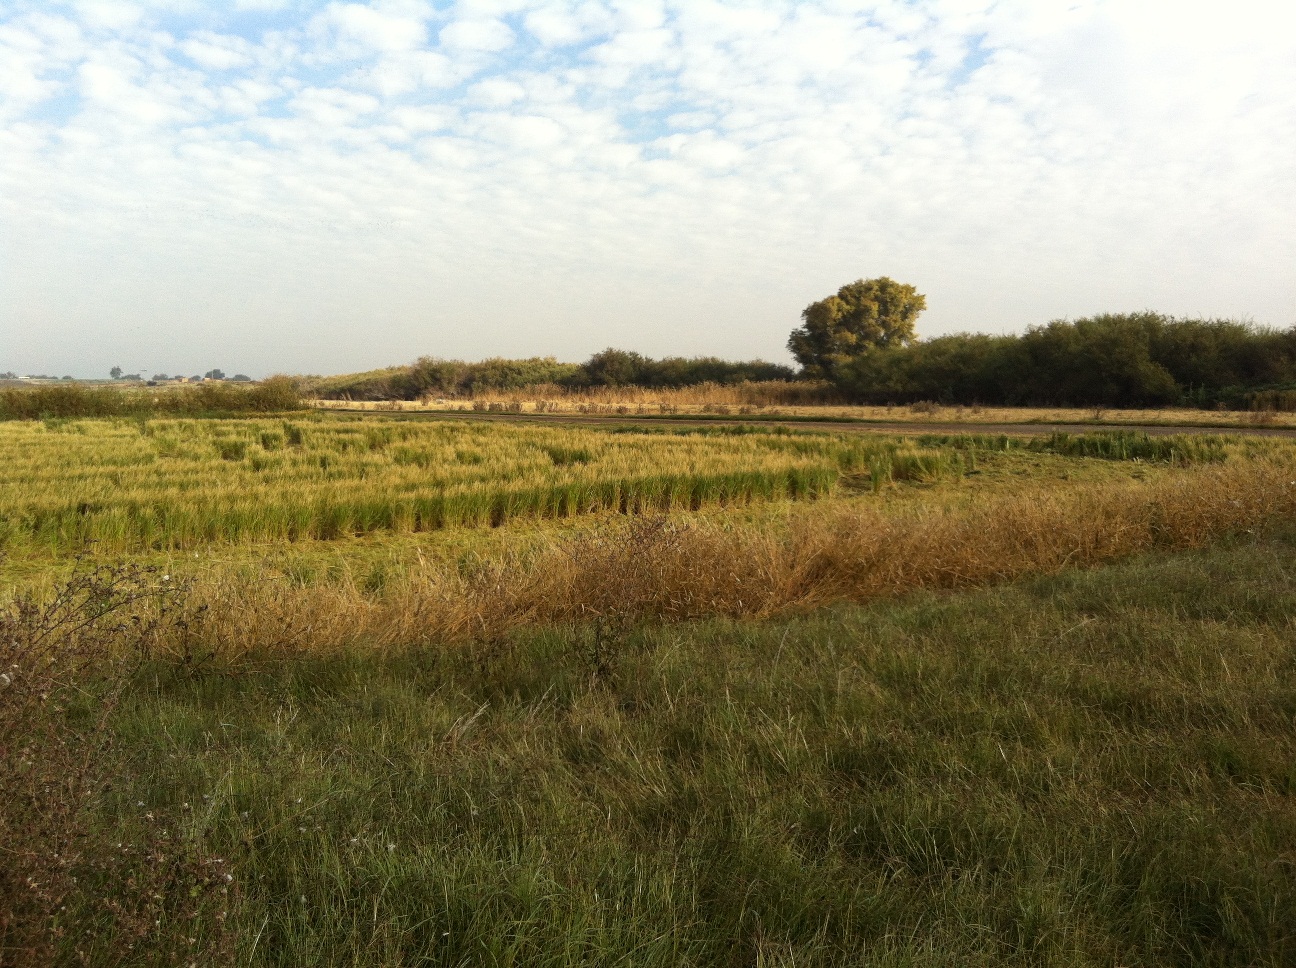
20121115TW_shaved_mowed2.jpg ( 2012-11-15 09:42:59 ) Full size: 1296x968
Harvested rice field
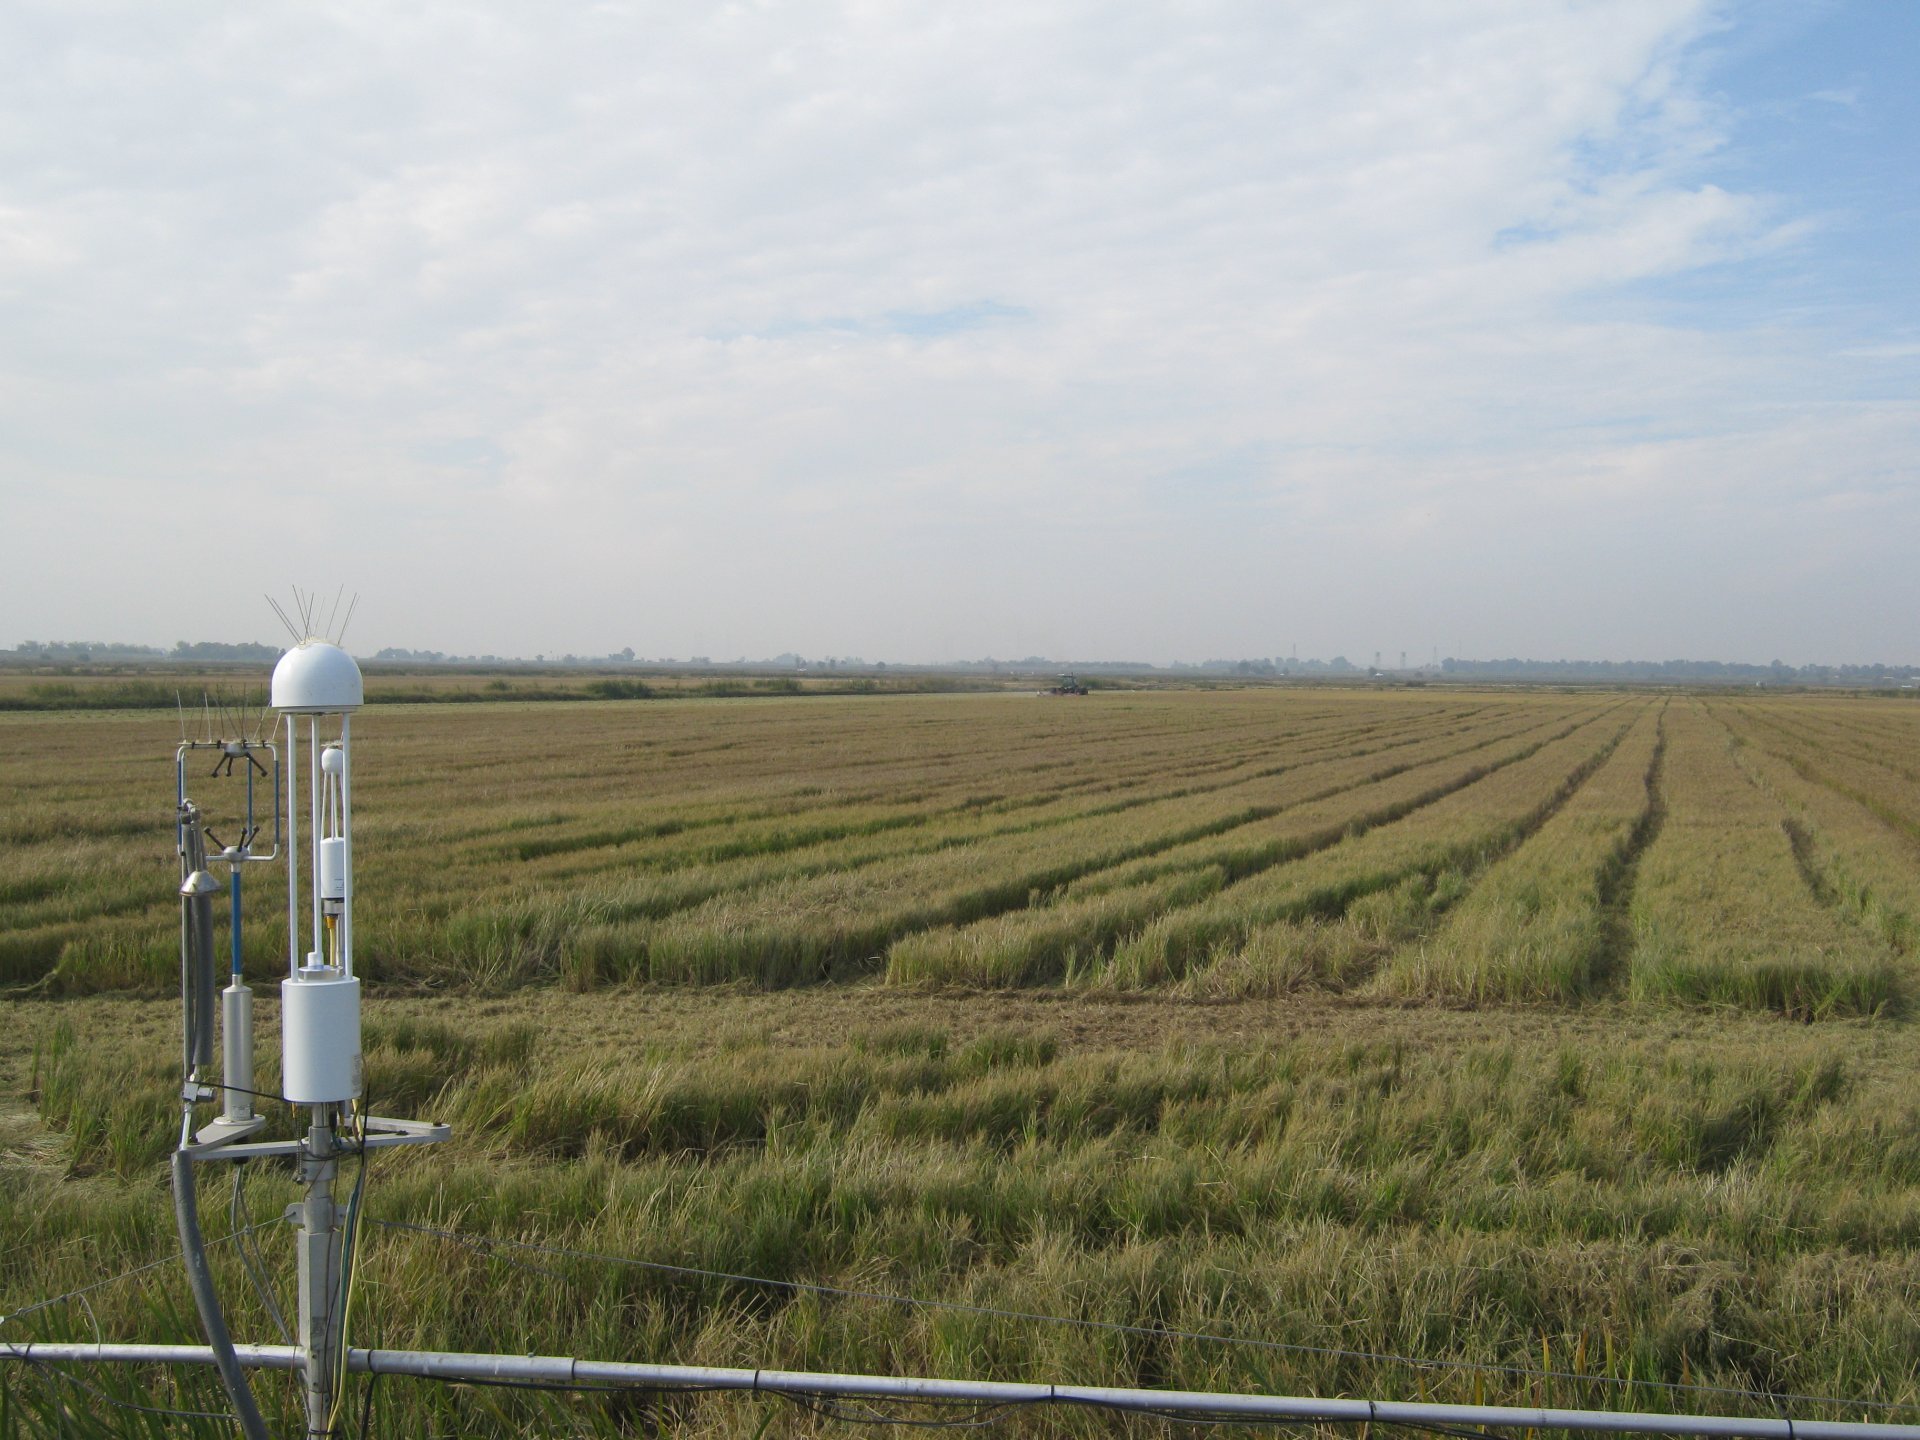
TW_autocam_20121115_1045.jpg ( 2012-11-15 10:45:03 ) Full size: 1920x1440
Tractor harvesting the rice

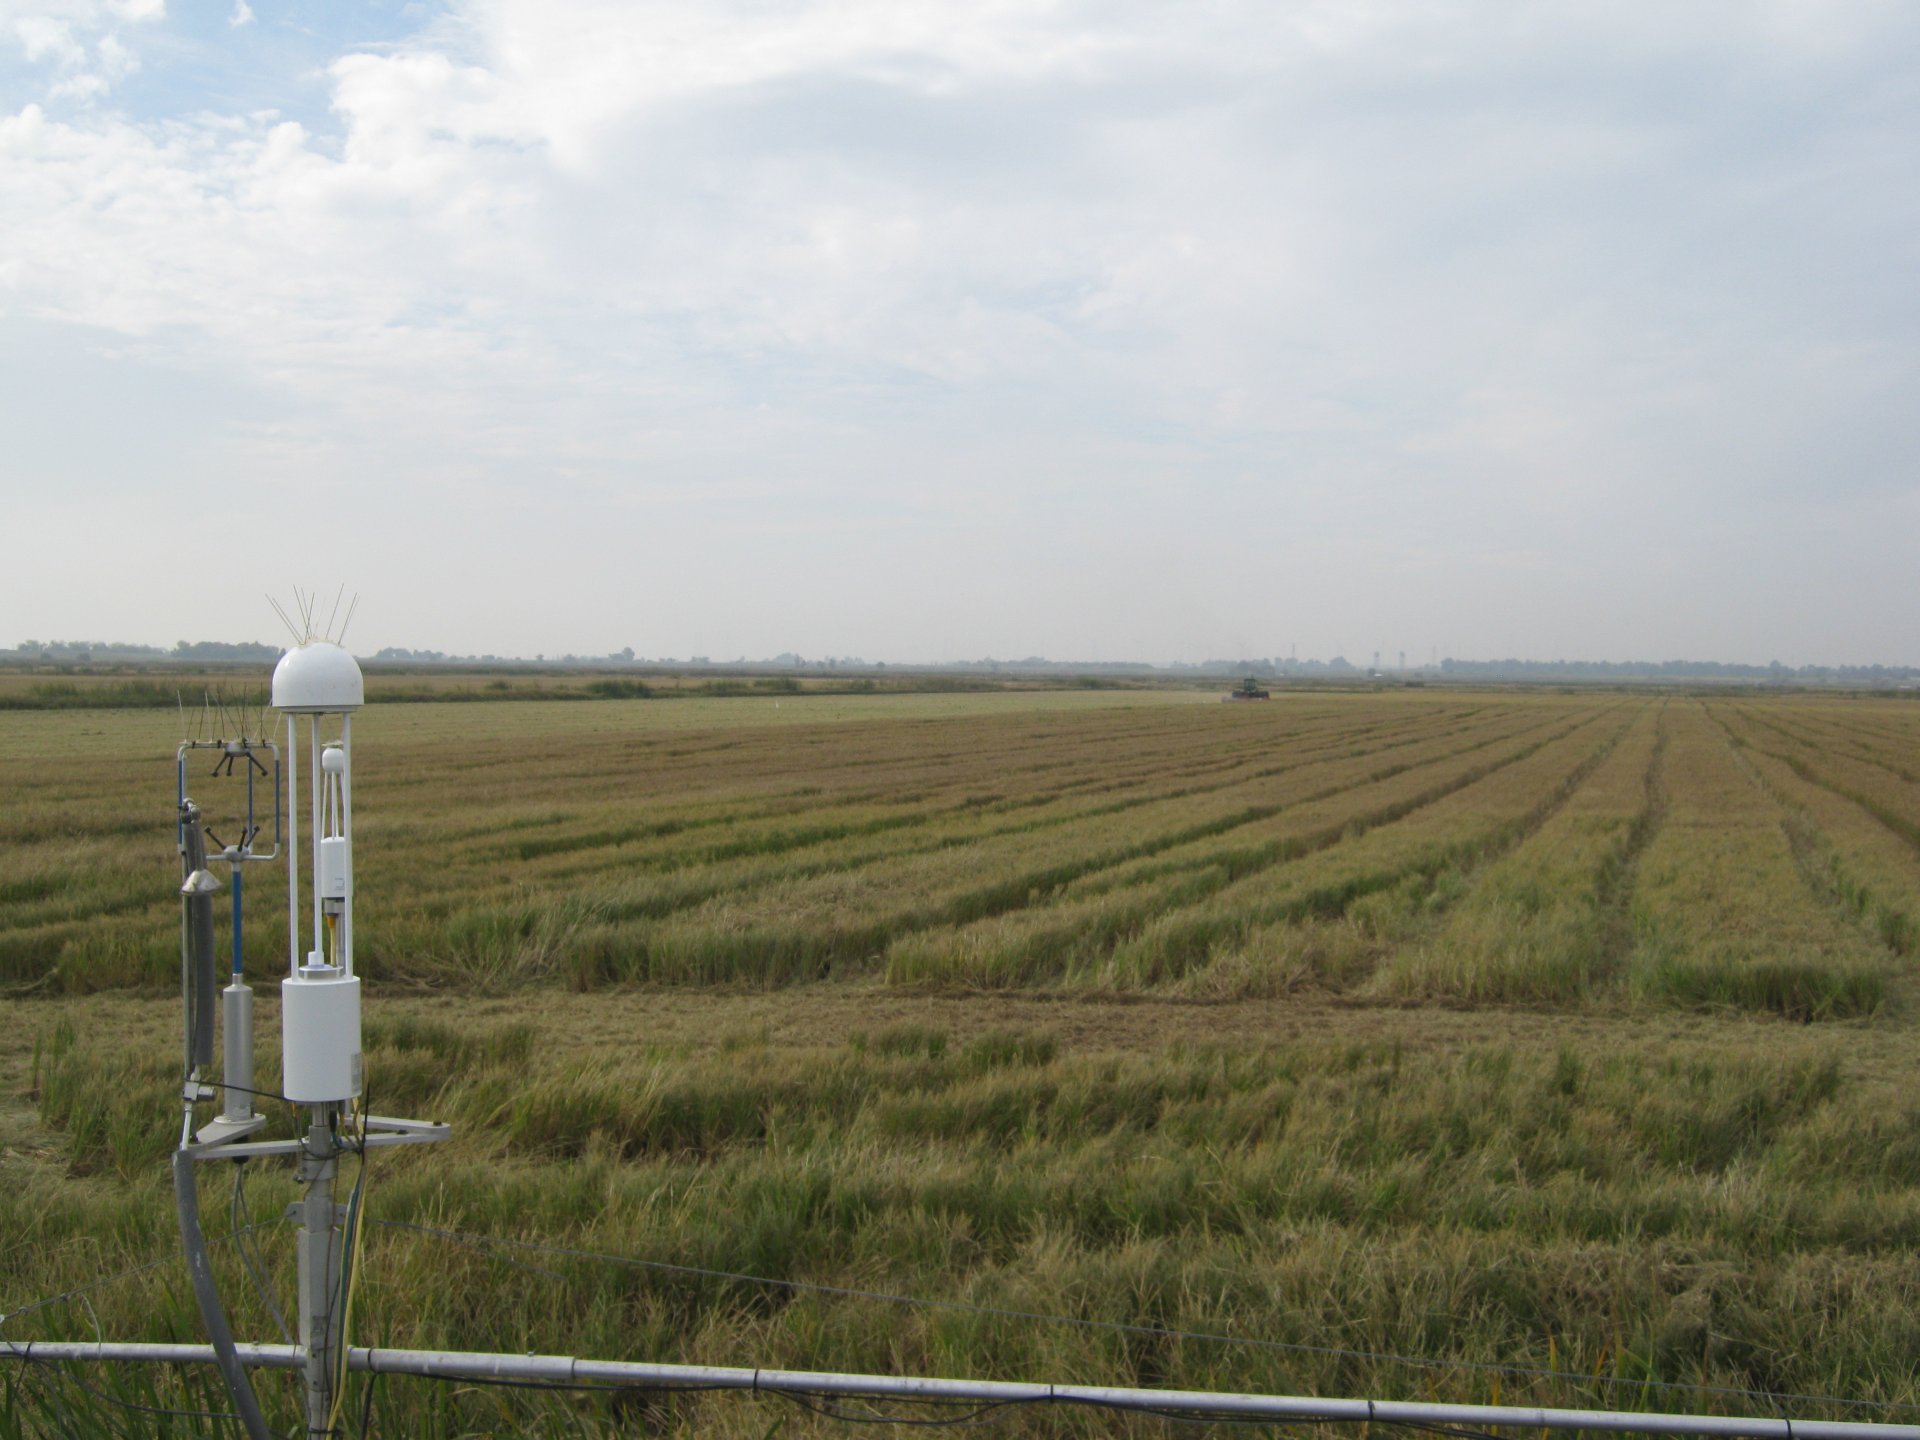
TW_autocam_20121115_1115.jpg ( 2012-11-15 11:15:02 ) Full size: 1920x1440
Tractor harvesting the rice
TW_autocam_20121115_1145.jpg ( 2012-11-15 11:45:03 ) Full size: 1920x1440
Tractor harvesting the rice

TW_autocam_20121115_1415.jpg ( 2012-11-15 14:15:02 ) Full size: 1920x1440
Tractor harvesting the rice
TW_autocam_20121115_1445.jpg ( 2012-11-15 14:45:02 ) Full size: 1920x1440
Tractor harvesting the rice
6 sets found
12 TW_met graphs found
5 TW_flux graphs found
Can't check TWSI_mixed
Can't check SIMBTWEE_met
1 TW_cam graphs found
Can't check TATWBABCSB_cam