Field Notes

<--2012-11-07 11:00:00 | 2012-12-11 09:00:00-->
Other sites visited today: Vaira | Sherman Island | Mayberry | Twitchell Rice | West Pond | DWR Corn
Phenocam link: Searching...

Tonzi: 2012-11-15 10:00:00 (DOY 320)
Author: Joe Verfaillie
Others:

Summary: Installed ATI, reset fixed? tram, swapped co2 profile cr10x battery, added relays to open and tree2 co2 probes.

Tonzi
2012-11-15

I arrived about 10am PST. It was mostly sunny and mild with little to know wind and high clouds moving in from the southwest. The trees looked barer than last week. The ground was dry and hard but there was some dew on the grass – more dew here than at Vaira.

The tram had derailed again. It ran just after I restarted it and I discovered that it was derailing because the wheels were too narrow for the track. Last time I fixed the wheels I added two shims to make the wheels more narrow because I though previously that the wheels were too wide. I removed one of the shims. Hopefully the wheels are just right now.

I installed the ATI sonic at the top of the tower. I moved the extra post from the west railing to the south railing. The ATI was mounted to the east of the Gill. I connected the ATI to the CR1000 on Com3. I removed the CF card, uploaded the new program and then inserted a new card. All seemed well. The new program has two new tables for the ATI data. Total fill time is about 45 days.

I swapped the battery on the CO2 profile CR10X. After restart a bunch of flags and ports were set. I reset the data logger’s clock and the reloaded the program and all seemed well. The LI800 had reasonable readings of about 420ppm.

I added relays to the soil CO2 system. I was hoping I could do all the probes with just two relays but I will need a third relay. I added a relays to the open and tree 2 probes. I downloaded the data from the CR23X and the CR10X before uploading new programs that control the relays. The probes now power up at 9min to 17min into the half-hour and data is logged from 14min to 17min.

I cleaned the z-cam windows – all had a smudge of dried water on them.

Field Data

No tank data

No TZ Well data found

No TZ Moisture Point data found

No VR Moisture Point data found

No TZ grass heigth found

No VR grass heigth found

No TZ Tree DBH found

No water potential data found

No TZ Grass Biomass data found

No TZ OakLeaves Biomass data found

No TZ PineNeedles Biomass data found

2 photos found
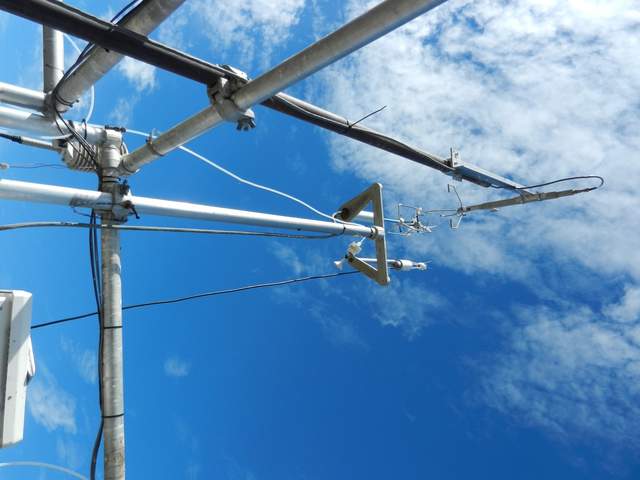
Testing an ATI sonic at Tonzi
20121115TZ_ATIMounting1.jpg ( 2012-11-15 12:18:56 ) Full size: 1920x1440
Testing an ATI sonic at Tonzi
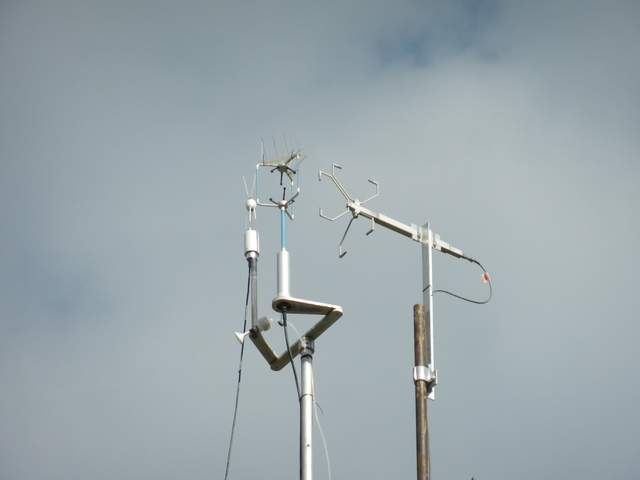
Testing an ATI sonic at Tonzi
20121115TZ_ATIMounting2.jpg ( 2012-11-15 13:38:29 ) Full size: 1920x1440
Testing an ATI sonic at Tonzi

Graphs display:
16 sets found

No data found for TZ_Fenergy.
11 TZ_tmet graphs found

Explore the graph:Tonzi Tower Met: Temperature and Power in a new window

Explore the graph:Tonzi Tower Met: Solar Radiation in a new window

Explore the graph:Tonzi Tower Met: IRT Sensors in a new window

Explore the graph:LED Sensor Incoming in a new window

Explore the graph:LED Sensor Outgoing in a new window

Explore the graph:4-Band Solar Radiation in a new window

Explore the graph:Air Temperature Profile in a new window

Explore the graph:Relativity Humidity Profile in a new window

Explore the graph:Tonzi Tower PRI in a new window

Explore the graph:SRS PRI/NDVI in a new window

Explore the graph:SRS NDVI in a new window

11 TZ_soilco2 graphs found

Explore the graph:Tonzi Soil CO2 Profile: Open (East) CO2 in a new window

Explore the graph:Tonzi Soil CO2 Profile: Tree (West) CO2 in a new window

Explore the graph:Tonzi Soil CO2 Profile: Open (East) Temperatures in a new window

Explore the graph:Tonzi Soil CO2 Profile: Tree (West) Temperatures in a new window

Explore the graph:Tonzi Soil CO2 Profile: Upper CO2 in a new window

Explore the graph:Tonzi Soil CO2 Profile: Lower CO2 in a new window

Explore the graph:Tonzi Soil CO2 Profile: Upper Temperatures in a new window

Explore the graph:Tonzi Soil CO2 Profile: Lower Temperatures in a new window

Explore the graph:Tonzi Soil CO2 Profile: Power and Temperature in a new window

Explore the graph:Tree 2 Soil CO2 in a new window

Explore the graph:Tree 2 Soil Temperature in a new window

Can't check TZ_mixed
3 TZ_mixed graphs found

Explore the graph:Tonzi PPT in a new window

Explore the graph:Tonzi CO2 and H2O Densities in a new window

Explore the graph:Air Pressure in a new window

1 TZ_fflux graphs found

Explore the graph:Tonzi Wind Speed in a new window

8 TZ_fmet graphs found

Explore the graph:Soil Heat Flux in a new window

Explore the graph:Tonzi Soil Temperature Set A in a new window

Explore the graph:Tonzi Soil Temperatures Set B in a new window

Explore the graph:Tonzi Soil Temperatures Set C in a new window

Explore the graph:Tonzi Soil Temperature Set D in a new window

Explore the graph:Well Level in a new window

Explore the graph:Well Water Temperature in a new window

Explore the graph:Soil Water Potential in a new window

1 TZ_tram graphs found

Explore the graph:Tonzi Tram Incoming PAR in a new window

3 TZ_co2prof graphs found

Explore the graph:Tower CO2 Profile Concentrations in a new window

Explore the graph:Tower CO2 Profile Cell Pressure in a new window

Explore the graph:CO2 Profile Sensor Temperature in a new window

No data found for TZ_irt.
No data found for TZ_windprof.
1 TZ_tflux graphs found

Explore the graph:Tower CO2 and H2O in a new window

2 TZ_sm graphs found

Explore the graph:Floor Solar Radiations in a new window

Explore the graph:TZ Soil Moisture in a new window

Can't check TZ_met
1 TZ_met graphs found

Explore the graph:Floor and Tower RH in a new window

Can't check TZVR_mixed
8 TZ_osu graphs found

Explore the graph:Soil Moisture And Rain in a new window

Explore the graph:SP1 Solar Radiation in a new window

Explore the graph:SP1 Soil Temperature Profile in a new window

Explore the graph:SP1 Soil Heat Flux in a new window

Explore the graph:SP2 Soil Moisture in a new window

Explore the graph:SP2 Soil Temperature in a new window

Explore the graph:SP3 Soil Moisture in a new window

Explore the graph:SP3 Soil Temperature in a new window

No data found for TZ_fd.
Tonzi Z-cam data

plot of Tonzi z-cam LAI

plot of Tonzi z-cam gap fration