Field Notes
<--2012-10-11 13:15:00 | 2012-10-25 14:10:00-->Other sites visited today: Sherman Island | Mayberry | Twitchell Rice | DWR Corn
Phenocam link: Searching...
West Pond: 2012-10-18 13:00:00 (DOY 292)
Author: Cove Sturtevant
Others: Joe, Sara, Laurie
Summary: Joe got the syphon running with Brian. Put up ATI sonic. Water level under tower has raised.
| West Pond
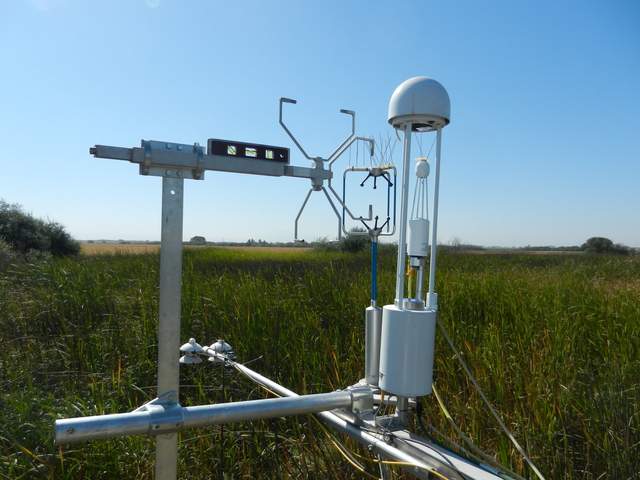
2012-10-18 We arrived about 13:00 PDT. Hot (30 °C), sunny, very light breeze. Joe was with Brian learning how to prime the syphon and back-flush the filter and they got the flow of water at the inlet coming in strong again. The water level at the site has raised and is now visible above the muck. Joe installed the ATI sonic which is now unfortunately behind the 7500, but that was the only way he could mount it. I checked the tower and helped Joe wrap up the installation. Sara and Laurie took water samples at the pier in the solar panel pond east of the tower. Current 7500 readings: CO2 = 404 ppm pre and post cleaning H2O = 640 mmol m-3 prior to cleaning, 700 after cleaning agc = 50, bumped to 43.8 after cleaning 7700 readings: CH4 = 2.2 ppm RSSI = 30 (bumped to 77 after cleaning) MET looked good, upper DO at 36.5, lower DO at 2.8 |
4 photos found

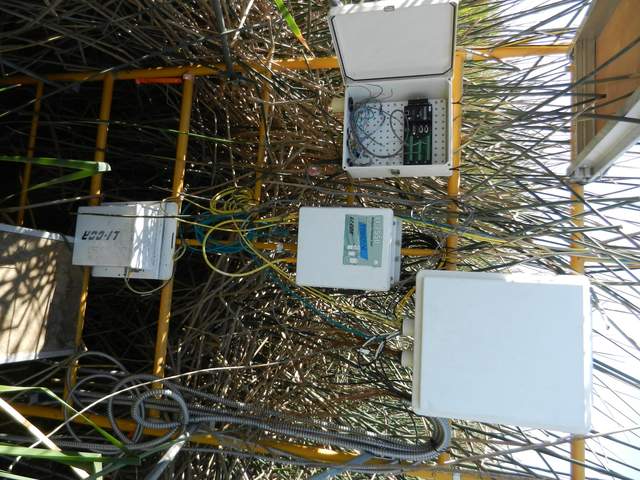
20121018WP_ATIDatalogger.jpg ( 2012-10-18 14:00:22 ) Full size: 1920x1440
ATI datalogger hanging on the scaffolding

20121018WP_ATIMount.jpg ( 2012-10-18 13:24:18 ) Full size: 1920x1440
ATI mounted behind 7500

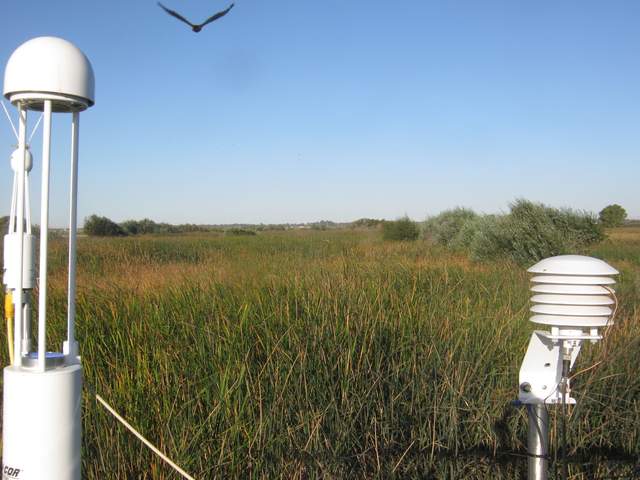
WP_autocam_20121017_0745.jpg ( 2012-10-17 07:45:02 ) Full size: 1920x1440
Hawk in flight

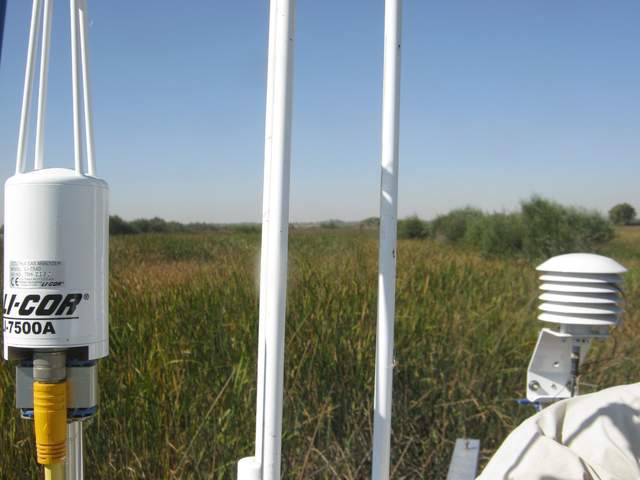
WP_autocam_20121018_1115.jpg ( 2012-10-18 11:15:02 ) Full size: 1920x1440
Installing ATI sonic
8 sets found
Can't check WP_DO
1 WP_DO graphs found
14 WP_met graphs found
5 WP_flux graphs found
Can't check MBWPEESWGT_mixed
Can't check MBEEWPSWEPGT_cam
Can't check MBSWEEWPBCBA
1 WP_processed graphs found
No data found for WP_arable.

