Field Notes
<--2012-09-06 09:00:00 | 2012-09-20 10:30:00-->Other sites visited today: Sherman Island | Twitchell Rice | West Pond | DWR Corn
Phenocam link: Searching...
Mayberry: 2012-09-13 09:45:00 (DOY 257)
Author: Cove Sturtevant
Others: Sara, Laurie
Summary: Portable: moved tower, removed spider webs from 7500 path, all else well. Permanent: reinstalled CO2 and DO sensors, slumping near tower holding fine, tower Vaisala perhaps 0.5 C low, but will double check next time.
| We arrived at about 09:45 PDT and moved the portable tower. The truck started up just fine so it seems the battery is still holding strong. The rear right tire we pumped up a few weeks back still looks good too.
After the move, Sara switched the USB stick, downloaded the files, and also refilled the 7700 reservoir. Laurie reinstalled the 7700 and cleaned it. RSSI rose from 49 to 71, and CH4 was 1.98 ppm. The path length of the 7500 was full of spider webs so Laurie cleared those out and wiped down the window. Afterward: CO2 = 405 ppm H2O = 760 mmol m-3 agc = 37.5 We then went to the permanent tower. I checked the tower while Sara and Laurie went into the water. Sara reinstalled the CO2 sensor in a new PVC pipe (both were installed at 10 cm below the water surface), put in a new lower DO probe (at -45 cm from water surface), and cleaned the incoming PAR sensor. Laurie took water samples. The upper DO probe (25cm below the water surface) looked kind of high (~46) when they returned, but it appeared to be decreasing, so we should check that it settled next time. Sara also refilled the 7700 reservoir on her return. The slumping near the tower looks the same as last week, the tower does not appear to be in danger yet. I switched the USB stick and downloaded the data to the computer. I also downloaded the 23x MET data and the autocam pics. Current 7500 readings: CO2 = 400 ppm H2O = 730 mmol m-3 agc = 43.8 t = 24.5 C 7700 readings: CH4 = 2.3 ppm RSSI = 45 (bumped to 75 after cleaning) MET values looked fine. I checked the tower Vaisala against the standard (again not realizing to keep the standard out of the sun before putting it into the shield to reduce the settling time). The tower Vaisala is perhaps reading half a degree low, but I’d like to affirm this next time. Standard: T = 23.8 C; RH =60% Tower probe: T = 22.5 C before, 23.3 C after; RH = 62.5% before, 58% after |
2 photos found

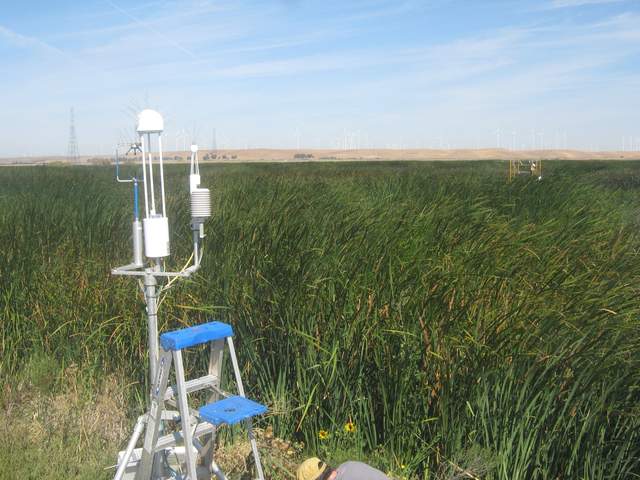
MB_autocam_20120913_1045.jpg ( 2012-09-13 10:45:02 ) Full size: 1920x1440
Field visit

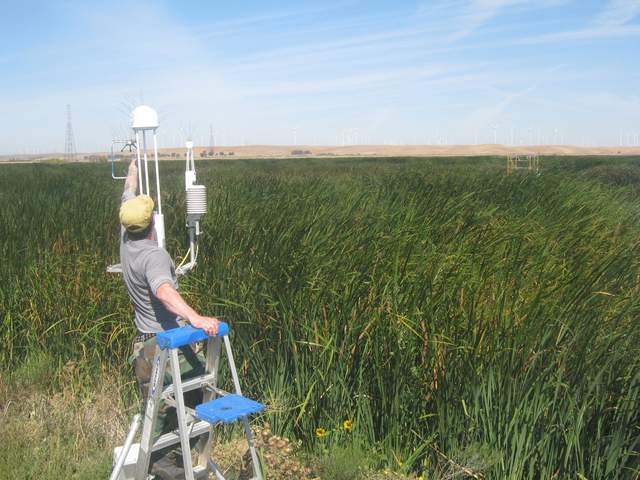
MB_autocam_20120913_1115.jpg ( 2012-09-13 11:15:02 ) Full size: 1920x1440
Cove cleaning the 7700
11 sets found
7 MB_flux graphs found
No data found for MB_met.
28 MB_tule graphs found
Can't check MBWPEESWGT_mixed
1 MB_cam graphs found
Can't check MBEEWPSWEPGT_cam
Can't check SIMBTWEE_met
No data found for MB_minidot.
Can't check MBSWEEWPBCBA
1 MB_processed graphs found
Can't check MB_fd
1 MB_fd graphs found

