Field Notes
<--2012-09-06 11:00:00 | 2012-09-20 11:10:00-->Other sites visited today: Sherman Island | Mayberry | West Pond | DWR Corn
Phenocam link: Searching...
Twitchell Rice: 2012-09-13 11:30:00 (DOY 257)
Author: Cove Sturtevant
Others: Sara, Laurie
Summary: Rice seeding heavily, tower readings good, wasp nest on tower
| Twitchell
2012-09-13 We arrived at approximately 11:30 PDT. Sunny and warm, perfect for donning waders. The rice is seeding heavily. I checked the tower while Sara did LAI and Laurie took clippings from the plots. Later on I did spectral measurements with Laurie. Note that the tripod was missing the top attachment so the boom was just resting on top and therefore may not have been perfectly level that week (relative to other weeks). The attachment of the boom to the tripod was missing, so Laurie just held it out in front of her and made sure the bubble in the window said it was level. I switched the USB stick and downloaded the flux data, MET, and autocam pics to the computer. Current 7500 readings: CO2 = 375 ppm H2O = 790 mmol m-3 agc = 43.8 t = 28.9 C 7700 readings: CH4 = 2.3 ppm RSSI = 45 (bumped to 75 after cleaning) MET values looked fine. I did not check this tower Vaisala against the standard we brought with us because there is now a very active wasp nest in the end of a crossbar near the probe. Climbing up the ladder to clean the 7700 was nerve-racking enough since I have a bee allergy (do I want to test it against wasps? NO!). Next time I shall bring better coverings, a head net, ample Benadryl, and more bravery to the task. Perhaps I shall even roar when I am finished. |
1 photos found

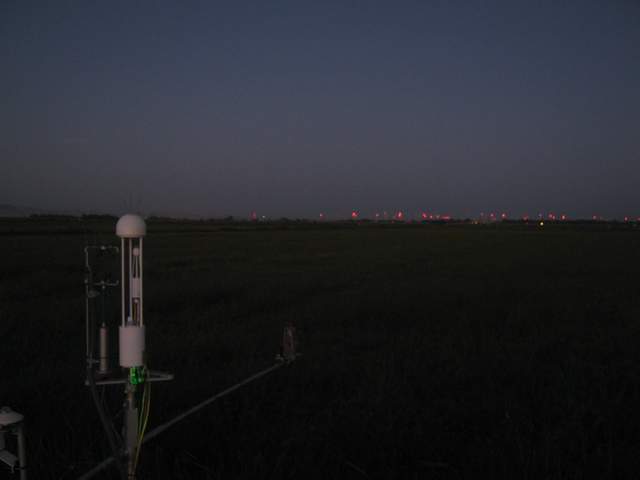
TW_autocam_20120913_0515.jpg ( 2012-09-13 05:15:11 ) Full size: 1920x1440
Owl on radiation boom
6 sets found
12 TW_met graphs found
5 TW_flux graphs found
Can't check TWSI_mixed
Can't check SIMBTWEE_met
1 TW_cam graphs found
Can't check TATWBABCSB_cam

