Field Notes
<--2012-08-16 08:15:00 | 2012-08-30 09:00:00-->Other sites visited today: Mayberry | Twitchell Rice | West Pond | DWR Corn
Phenocam link: Searching...
Sherman Island: 2012-08-23 09:15:00 (DOY 236)
Author: Cove Sturtevant
Others: Sara, Laurie
Summary: Swapped LGRs, slow 7500 data still bad, field was brown with a sprinkling of green
| Sherman
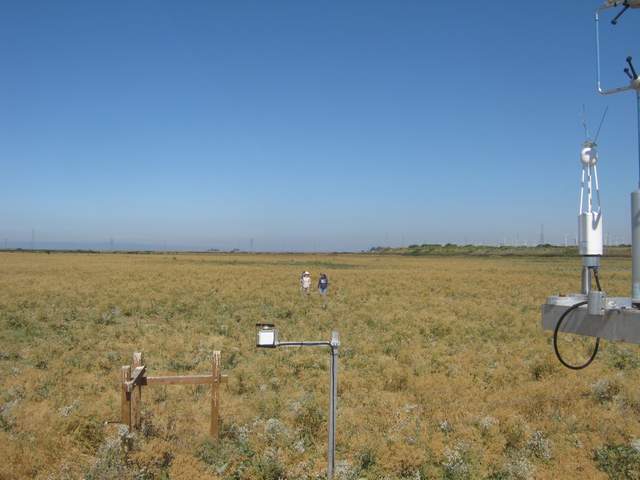
2012-08-23 I arrived about 09:15 PDT with Sara and Laurie. Weather was sunny and breezy, about 65 °F. The water in the ditch by the side of the road was still high and the field under the bridge still flooded. The plants at the site were mostly brown and dry looking with sprinklings of green. We drove into the site with the truck due to having the replacement LGR with us. I did the tower maintenance. Sara did the well water depth and soil cores while Laurie did the LAI measurements. Laurie added transect markings in the field for LAI. Sara and Laurie did spectral measurements together. When we arrived, the 7500 read: CO2: 16.2 mmol m-3 H2O: 720 mmol m-3 Diag: 248 The 10 Hz winds and concentration fluctuations looked good, as well as the MET data from the CR1000. The Soil CO2 table showed the Ref_ST4 to be –INF, but otherwise good. The CR10x showed TC2_8cm and Shelter_T to be –INF, but otherwise good. I swapped out LGR 2 with LGR 1. Prior to the swap, LGR 2 read: 08:25, 21.44 °C, 142.2 Torr, 14.993 us, 10 Hz, 1.785 ppm, ch4_20120816_001.txt. The swap went smoothly and I adjusted the flow bypass valve. After the swap, LGR 1 read: 08:49, 22.63 °C, 143.6 Torr, 13.8 us, 10 Hz, 1.86 ppm, ch4_20120823_006.txt. After the LGR swap was complete, I reached over the computer and CR1000 tray to get to the back of the LGR to make sure all cable connections were tight. In doing so I believe I lightly brushed the power cable to the computer. When I straightened up, Windows was restarting. I reached back and simply touched the power cable again and Windows restarted again. The computer restarted fine and all measurements were good and still collecting. This appears to be a touchy power connection, so I will take care in the future to avoid it. Next, I took a look at the half-hourly CR1000 table due to the 7500 averages showing bad numbers in the data downloaded last week. Joe and I both looked at the program (CR1kFlux_v20120502.CR1) for errors and could find none. Viewing the half-hourly table in the field confirmed the bad numbers. li_CO2 Avg was -28.26 and the rest of the averages were NaN. The only good values were maximums, such as the diagnostic value. The numbers from all other sensors looked good. In the hopes that reloading the program would fix this issue, I pulled the flashcard with the previous week’s data, put in a fresh card, and reloaded the program. The program took a long time to compile, but I don’t think this is out of the ordinary. Laurie and Sara were still taking measurements at 10:30 PDT, so I was able to see whether the reload worked after the half-hour mark. It did not, as the LI7500 averages were still bad. I tried a small adjustment to the program which I did not have high hopes for, but tried anyway since we could find no problems in the code. I adjusted the half-hourly (Slow) table definition to use the original variable names for the LI7500 data instead of the aliases. I renamed the new program CR1kFlux_v20120823.CR1 and uploaded it to the CR1000. We waited just a few minutes for 11:00 PDT to arrive to see if this worked. It did not. We left at 11:10 PDT. |
1 photos found

SI_autocam_20120823_0945.jpg ( 2012-08-23 09:45:02 ) Full size: 1920x1440
Field visit, Sara and Laurie
7 sets found
No data found for SI_mp.
11 SI_met graphs found
Can't check SI_mixed
2 SI_mixed graphs found
4 SI_flx graphs found
3 SI_soilco2 graphs found
Can't check TWSI_mixed
Can't check SIMBTWEE_met

