
Field Notes
<--2012-07-05 09:00:00 | 2012-07-19 09:30:00-->Other sites visited today: Mayberry | Twitchell Rice | West Pond | DWR Corn
Phenocam link: Searching...
Sherman Island: 2012-07-12 10:00:00 (DOY 194)
Author: Joe Verfaillie
Others: Sara, Carina
Summary: Left calibration equipment, calibrated LGR, checked soil CO2.
| Sherman
2012-07-12 I arrived about 10:00. It was clear, sunny and hot with a west wind. The pepper weed flowers are still yellow. The area south of the tower did not look as trampled as it did last week. Sara and Carina were here earlier doing the standard fieldwork. I brought the CH4 cal tank, wrench and regulator to calibrate the LGR. When I arrived the LGR read: 10:04PDT, 21.05C, 136.36Torr, 14.920usec, 10Hz, 1.885ppm I adjusted the bypass valve to bring pressure to 146.9Torr. The cal tank has 500psi of 1.976ppm CH4 air. Before calibration the LGR read: 10.11PDT, 21.44C, 83.53Torr, 14.870usec, 1Hz, 2.044ppm The external 2um filter seemed okay, so the internal one or the pressure controller might be plugged up. Running the cal gas the LGR read 1.985ppm. The last cal was May 1, 2012. After calibration the LGR read: 10.21PDT, 22.22C, 149.85Torr, 14.899usec, 10Hz, 1.817ppm I checked the soil CO2 data. I didn’t see any missing data, but there was at least one short half hour with only about half the usual readings. I still need to work on the way the program starts and stops logging. All the other data looked okay. I need to put some WD40 on the lock for the box. |
2 photos found
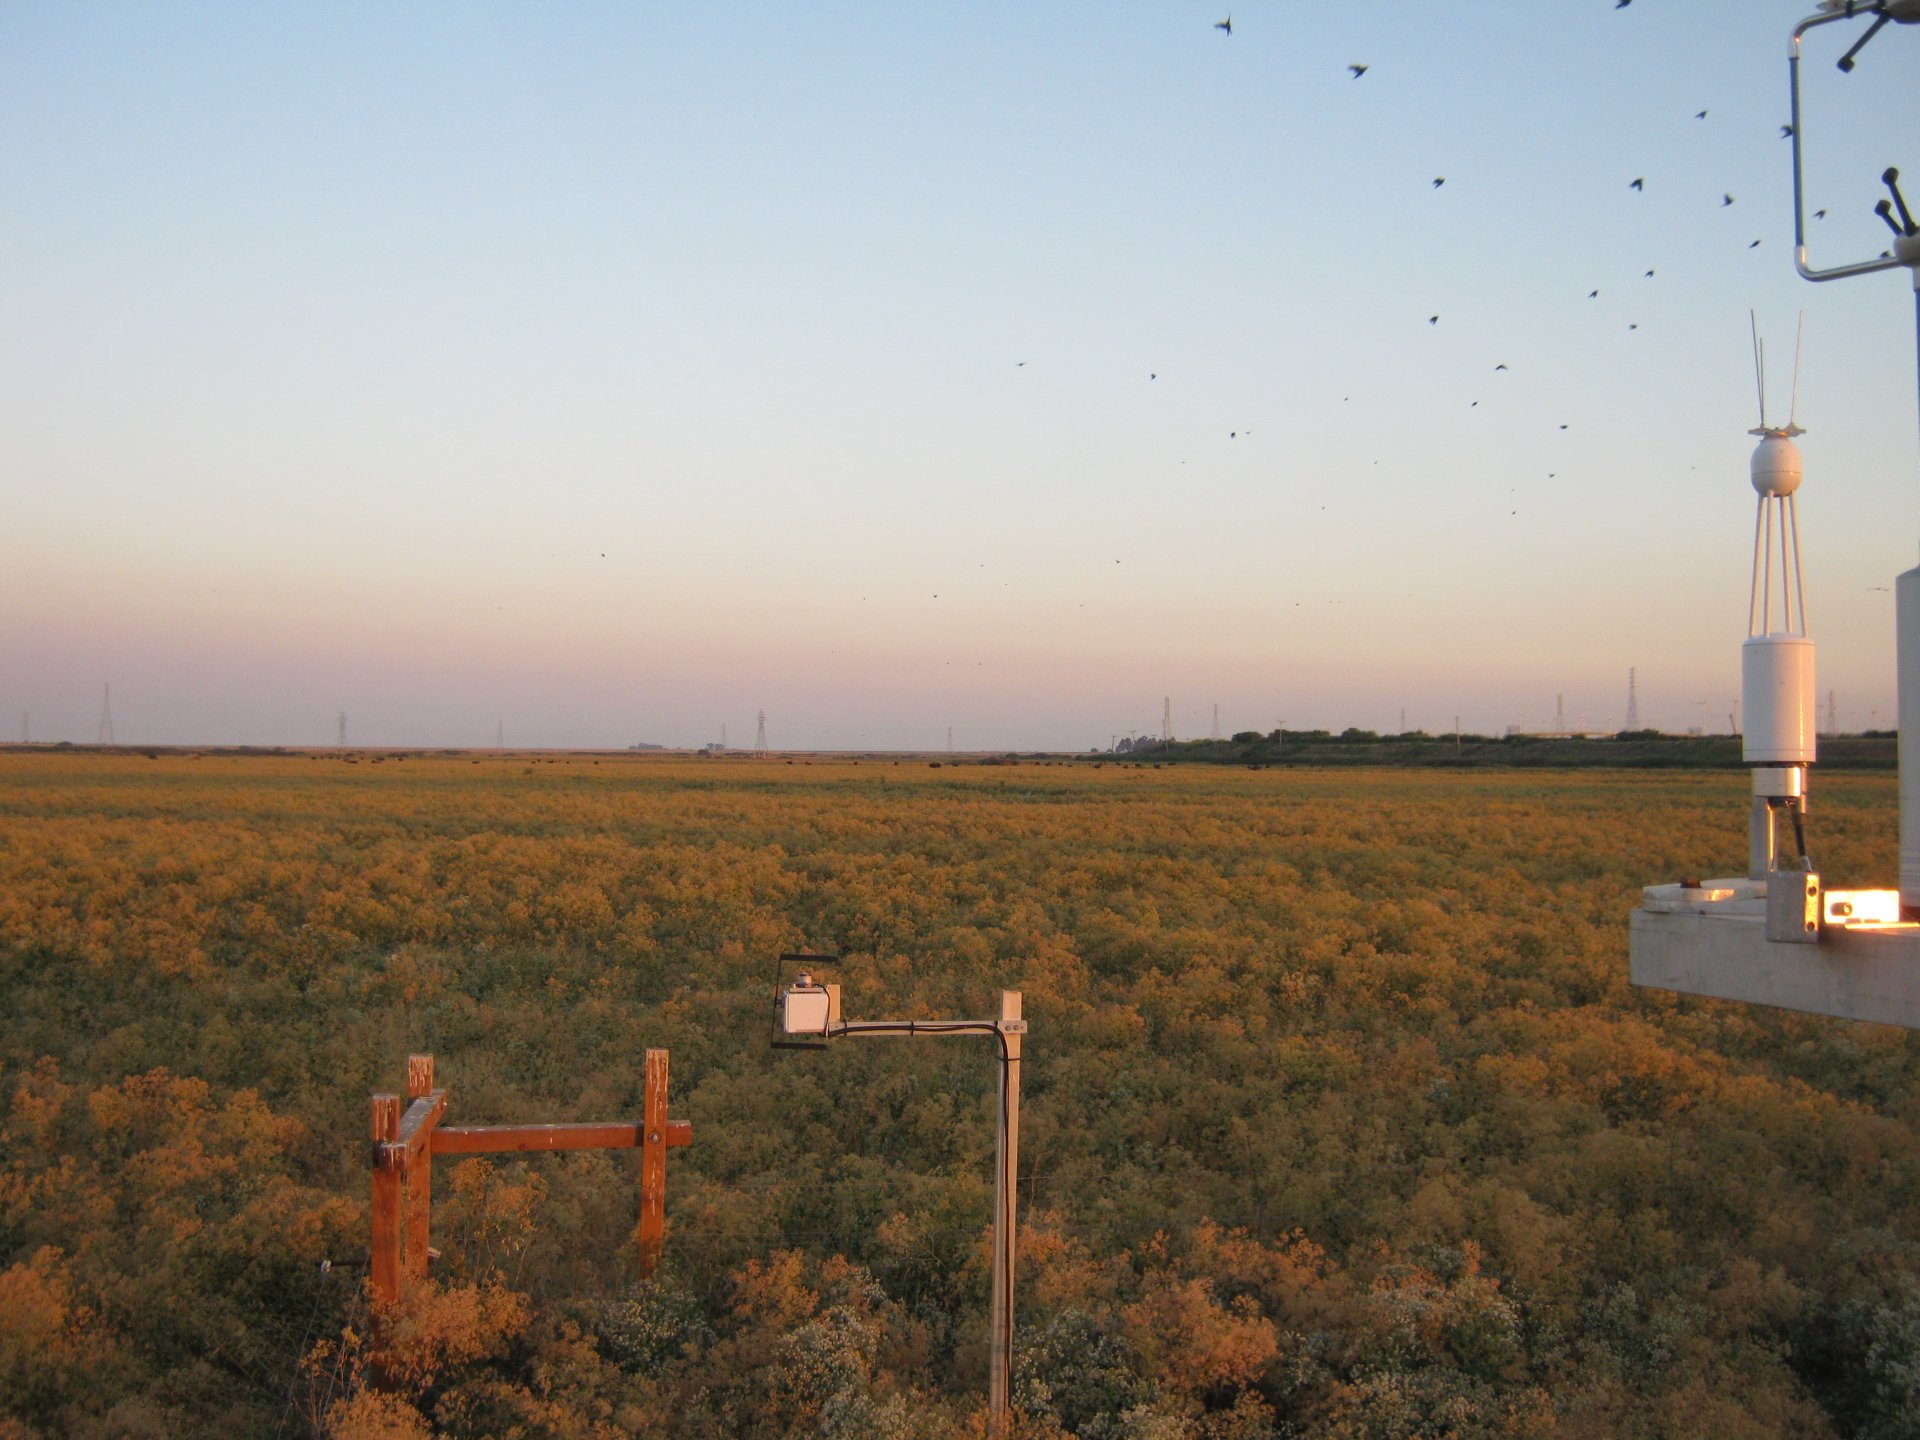
SI_autocam_20120712_0515.jpg ( 2012-07-12 05:15:07 ) Full size: 1920x1440
Crows at dawn
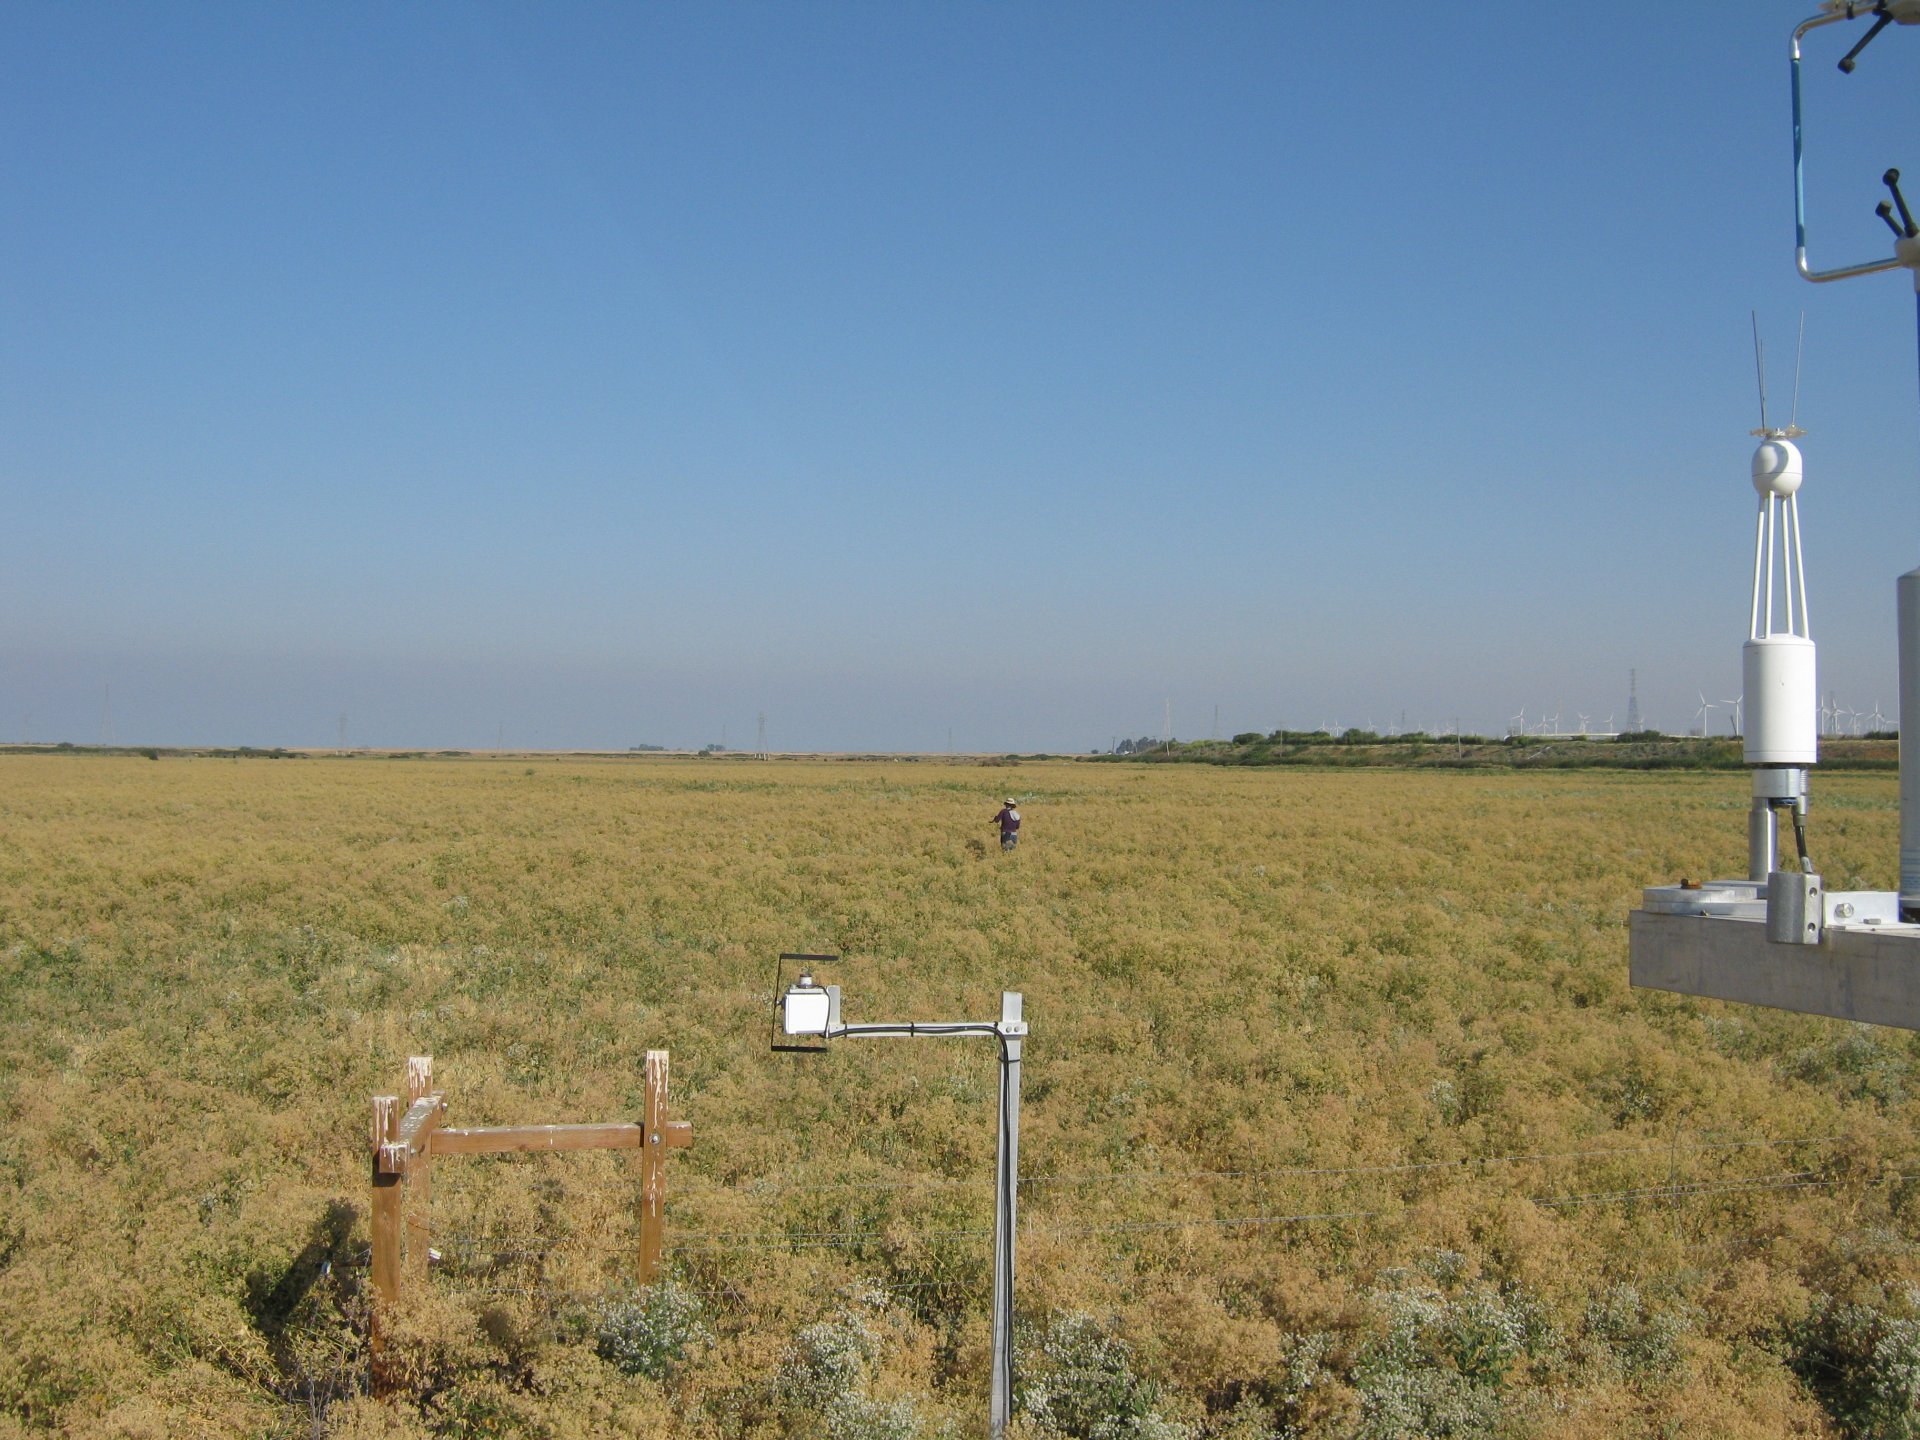
SI_autocam_20120712_0745.jpg ( 2012-07-12 07:45:02 ) Full size: 1920x1440
Fieldwork
7 sets found
No data found for SI_mp.
11 SI_met graphs found
Can't check SI_mixed
2 SI_mixed graphs found
4 SI_flx graphs found
3 SI_soilco2 graphs found
Can't check TWSI_mixed
Can't check SIMBTWEE_met