
Field Notes
<--2012-06-29 11:30:00 | 2012-07-12 10:00:00-->Other sites visited today: Mayberry | West Pond | DWR Corn | Twitchell Rice
Phenocam link: Searching...
Sherman Island: 2012-07-05 09:00:00 (DOY 187)
Author: Joe Verfaillie
Others: Sara, Carina
Summary: Standard fieldwork and data collection, update to soil CO2 program to avoid missing data.
| Sherman
2012-07-05 I arrived about 9:00PDT with Sara and Carina. It was clear, sunny and warm with little to no wind but building to a gusty breeze from the west. The pepper weed is yellow brown. There were tire tacks through the weeds to the south of the tower and the weeds looked trampled by cows. The patches of hell weeds don’t seem to be as think or healthy this year. Caltrans seems to be mostly done. The area under the bridge to the south of the road was flooded. When we arrived the LGR read: 9:25PDT, 20.63C, 142.43Torr, 15.035usec, 10Hz, 1.906ppm. We need to calibrate the LGR, there is a tank at Mayberry. I’m thinking to order some smaller more portable tanks for the LI7700s. Sara and Carina did the standard field work plus soil chambers with the 6400. I collected the data and cleaned the radiation sensors. I also worked on the soil CO2 program. It seemed that data was missing because the power relay was not getting turned on. I changed the program from using the if time statement that only runs once to a checking a time range for turning on and off the relay and logging flag. It seemed to run okay once before we left. However it now logs one minute before the half hour to two minutes after the half hour. |
1 photos found
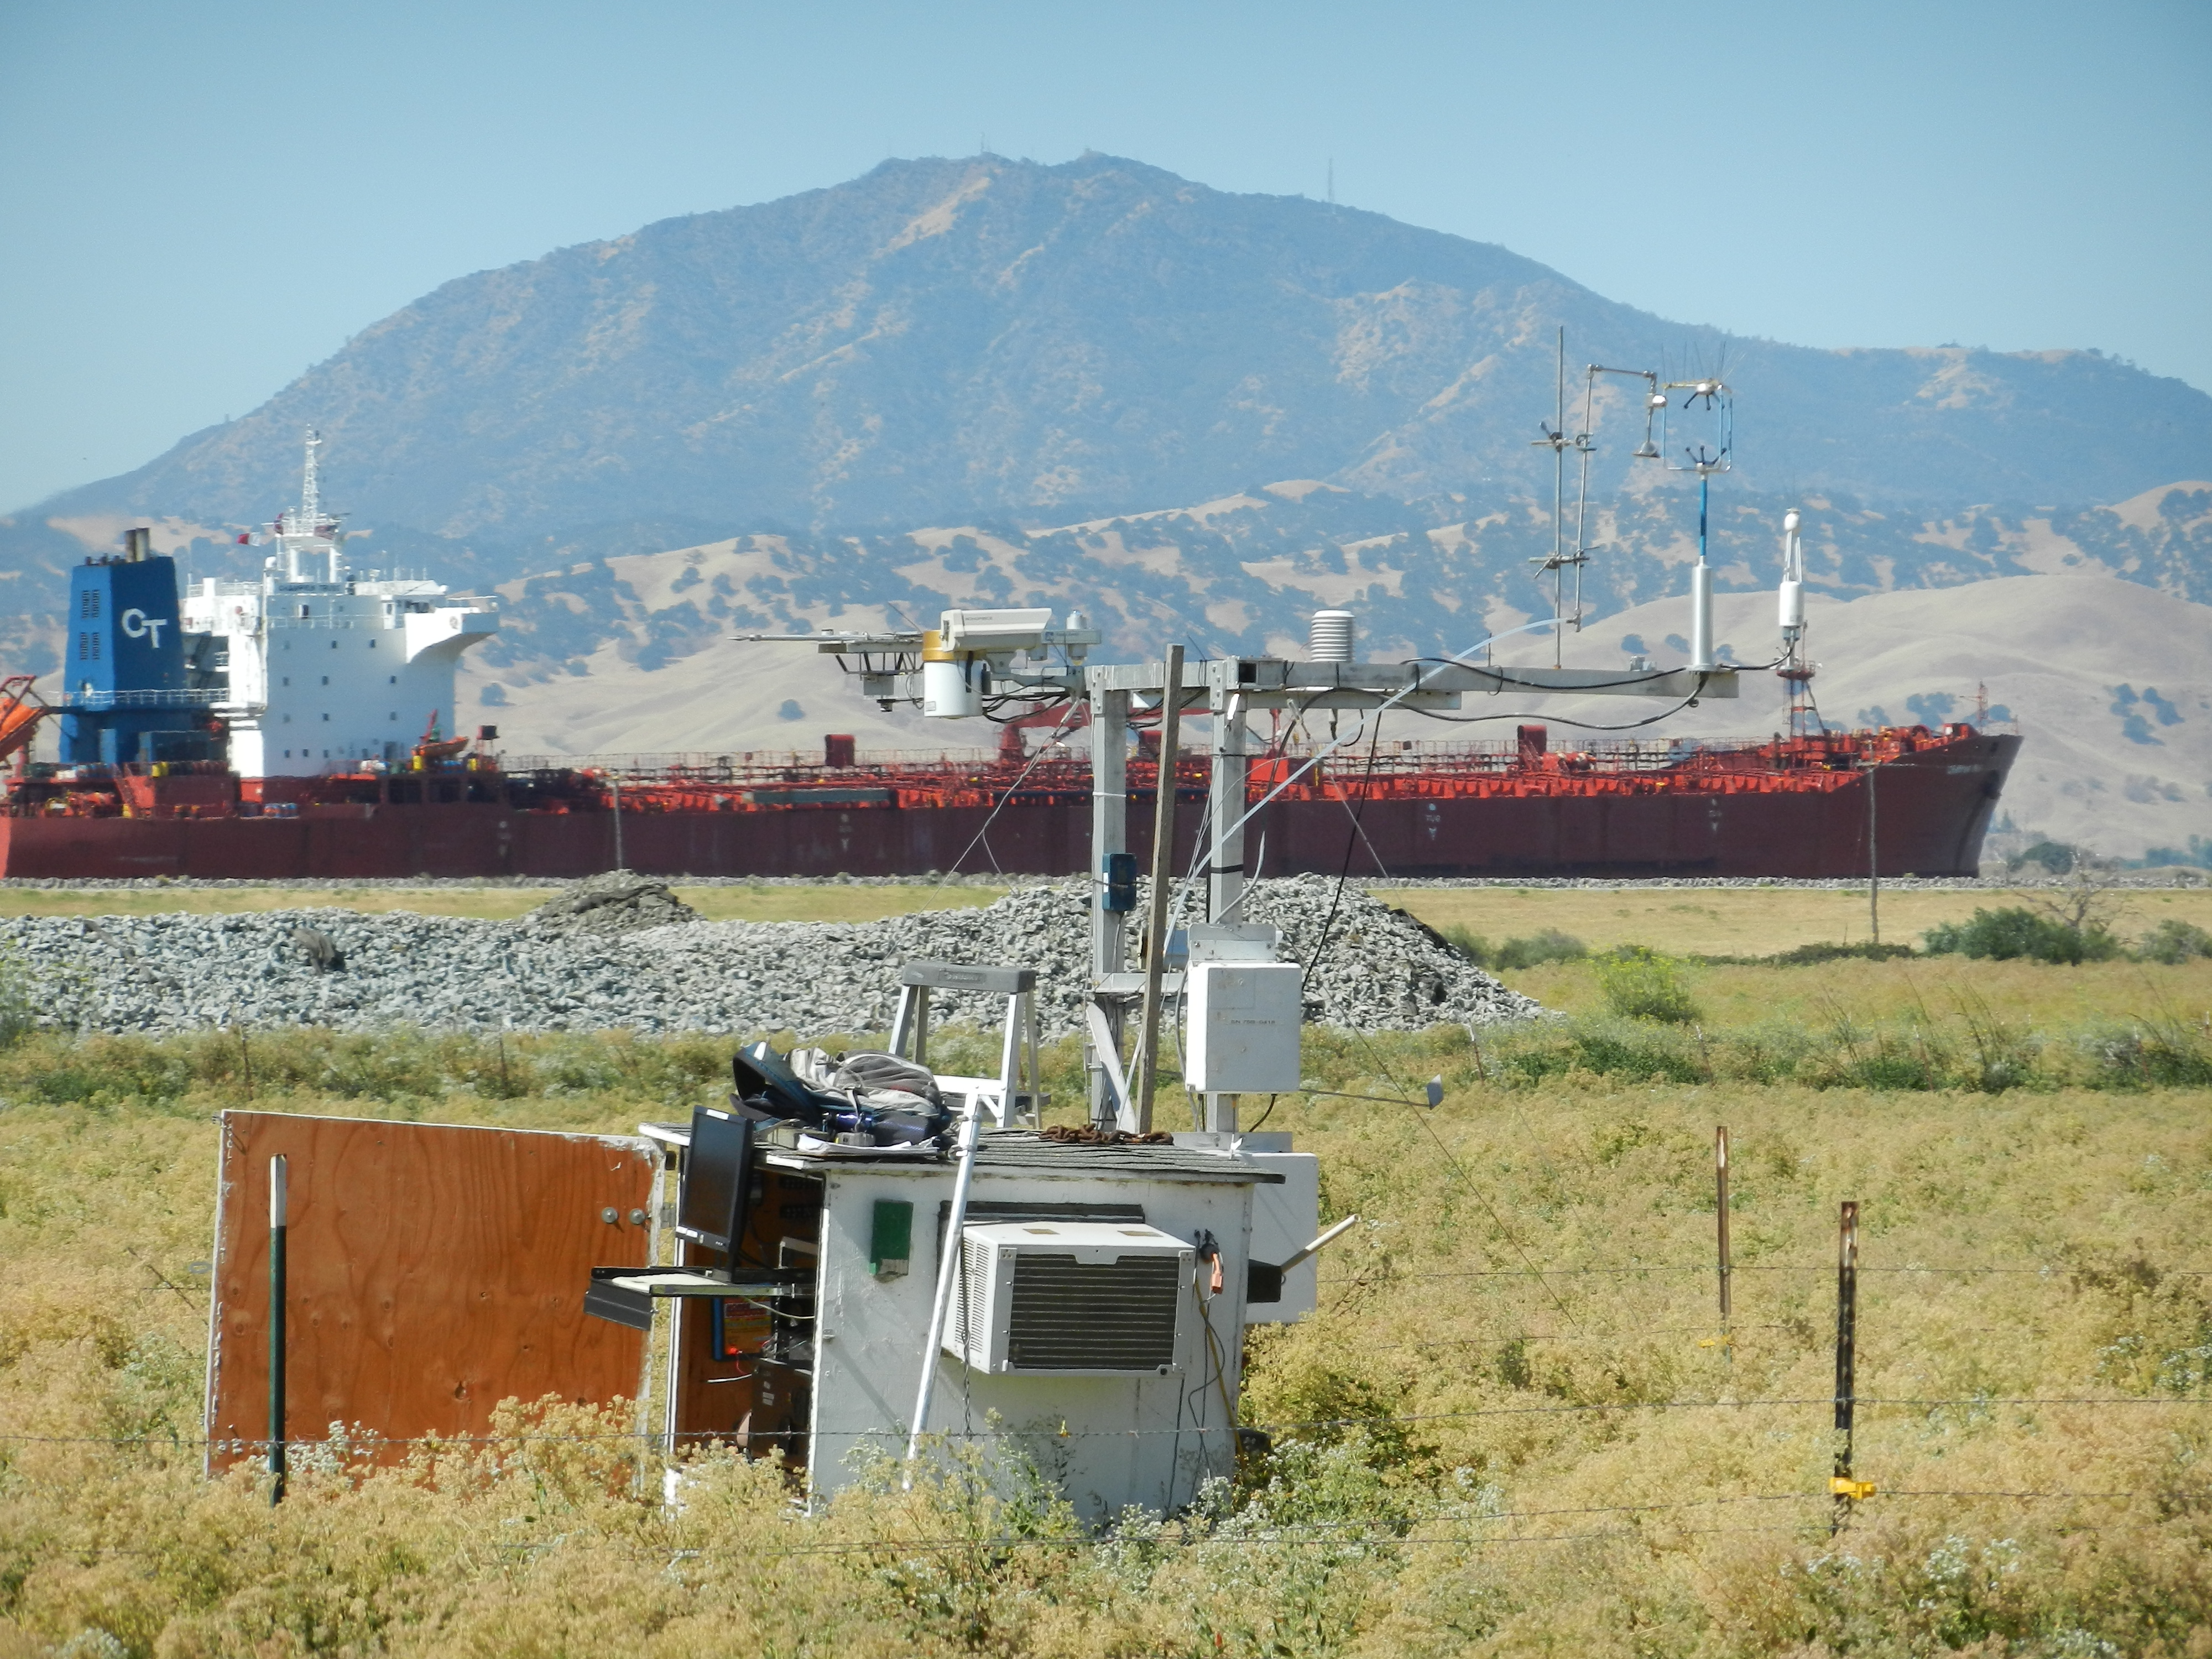
20120705SI_TowerShipDiablo.jpg ( 2012-07-05 10:13:06 ) Full size: 4000x3000
Ship above the pasture site with Mt Diablo in the background
7 sets found
No data found for SI_mp.
11 SI_met graphs found
Can't check SI_mixed
2 SI_mixed graphs found
4 SI_flx graphs found
3 SI_soilco2 graphs found
Can't check TWSI_mixed
Can't check SIMBTWEE_met