Field Notes
<--2012-07-12 10:00:00 | 2012-07-26 08:30:00-->Other sites visited today: Mayberry | DWR Corn | Twitchell Rice | West Pond
Phenocam link: Searching...
Sherman Island: 2012-07-19 09:30:00 (DOY 201)
Author: Joe Verfaillie
Others: Sara, Carina, Cristina
Summary: Collected data, standard fieldwork, soil chamber measurements, installed two theta probes with soil co2 and rewrote program, turned off old web cam.
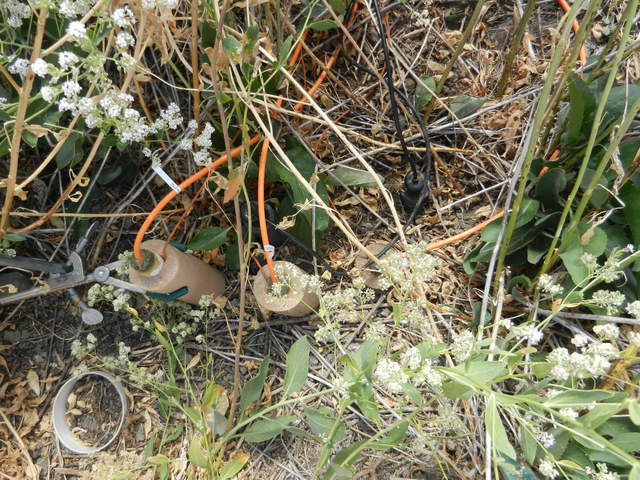
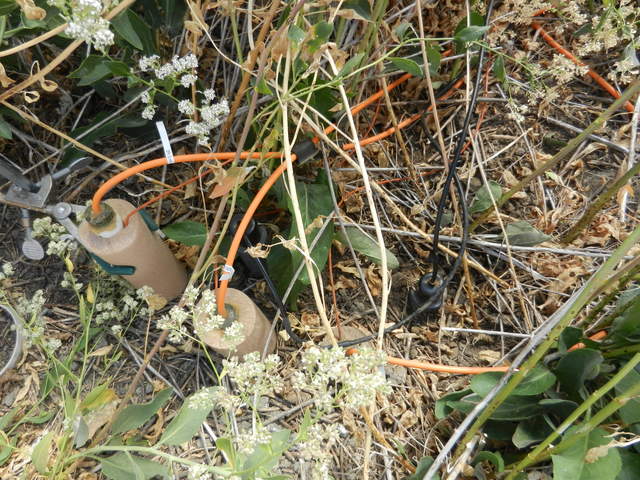
| Sherman 2012-07-19 I arrived about 9:30 with Sara, Carina and Cristina. It was sunny with some scattered high clouds and cool with a wind from the west. The pepper weed and other weeds in the field look a little greener today. When we arrived the LGR read: 9:37PDT, 20.93C, 144.70Torr, 15.019usec, 10Hz, 1.771ppm The CH4 concentration seems low. I collected all data. Sara made soil chamber measurements. Carina and Christina did the other standard fieldwork. We worked on the soil CO2 program and system some more. We installed two Theta probes near the west set of soil CO2 sensors. The theta probes went in vertically the first at about -8cm, the second probe sn 54/007 at -2cm. I checked the incoming PAR sensor, it seemed clean. I think I remember cleaning some bird poop off it last week. I removed the power from the old web cam and from the Ethernet router. Future images will come from the autocam only. |
3 photos found

20120719SI_ThetaProbeInstall1.jpg ( 2012-07-19 10:45:54 ) Full size: 4000x3000
Soil CO2 and soil moisture sensors in the ground

20120719SI_ThetaProbeInstall2.jpg ( 2012-07-19 10:45:59 ) Full size: 4000x3000
Soil CO2 and soil moisture sensors in the ground

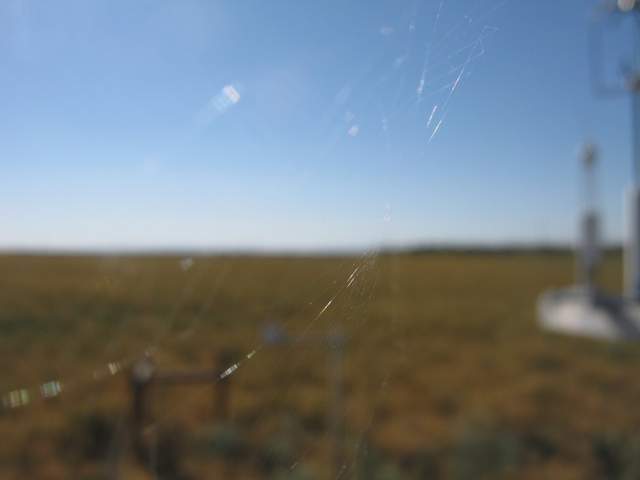
SI_autocam_20120720_1745.jpg ( 2012-07-20 16:45:02 ) Full size: 1920x1440
Spiderweb
7 sets found
No data found for SI_mp.
11 SI_met graphs found
Can't check SI_mixed
2 SI_mixed graphs found
4 SI_flx graphs found
3 SI_soilco2 graphs found
Can't check TWSI_mixed
Can't check SIMBTWEE_met

