Field Notes
<--2012-05-31 14:00:00 | 2012-06-13 09:30:00-->Other sites visited today: Mayberry | Twitchell Rice | West Pond | DWR Corn
Phenocam link: Searching...
Sherman Island: 2012-06-07 08:20:00 (DOY 159)
Author: Joe Verfaillie
Others: Sara, Carina
Summary: Swapped LI7500, swapped HMP45 fan and shield, updated soil CO2 program.
| Sherman
2012-06-07 I arrived about 8:20 with Sara and Carina. It was clear and sunny with a good breeze from the west. It was mild but warming quickly. Caltrans was no longer moving dirt and rock with heavy equipment. The pepper weed flowers are past peak and are beginning to die back. The density of the pepper weed in the field seems greater than usual. From the bridge the field looked wet. I swapped the LI7500. Sn 0418 went on and sn 0041 came off. I swapped the HMP45 fan and shield. The LGR was reading: 8:26PDT, 21.32C, 146.0Torr, 15.087usec, 10Hz, 1.851ppm I collected all data. We were missing a few days of the met data from a week or so ago, but the met CR10X only stores about 10 days of data. I changed the soil CO2 program to remove the high frequency and only store the 2min average at the end of the half hour. It looked okay, but need to check it next time out. I measured the wells. At the new well on the north side of the cow fence the pipe extends 51cm above the ground and the water level was 103cm below the top of the pipe (52cm below ground). At the old well on the south side of the cow fence the pipe extends 39cm above the ground and the water level was 87cm below the top on the pipe (48cm below ground). I measured the locations of the eddy sensors. The top of the tower boom where the eddy sensors are mounted is 252cm above the ground. The center of the sonic is 65cm above the boom. The center of the LI7500 is 30cm above the boom and 9cm North and 23.5cm West of the sonic. The LGR inlet is 57cm above the boom and 4.5cm South and 9cm East of the sonic. The LI7700 was 24cm South and 4cm East of the sonic. I cleaned the radiation sensors but they were pretty clean to begin with. I cleared pepper weed from around the outside of the cow fence. Sara and Carina did soil chamber measurements, soil moisture, spectral measurements and LIA 2000 and clip plots. Andy was there later servicing the mercury trailer. |
2 photos found

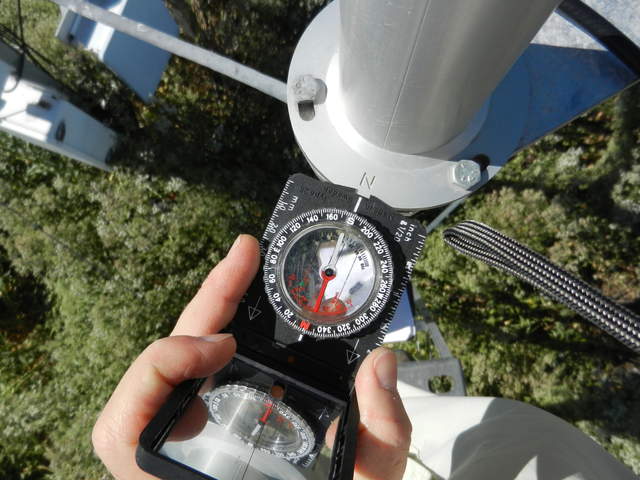
20120607SI_SonicHeading.jpg ( 2012-06-07 09:25:48 ) Full size: 4000x3000
Compass heading of the Sherman pasture sonic

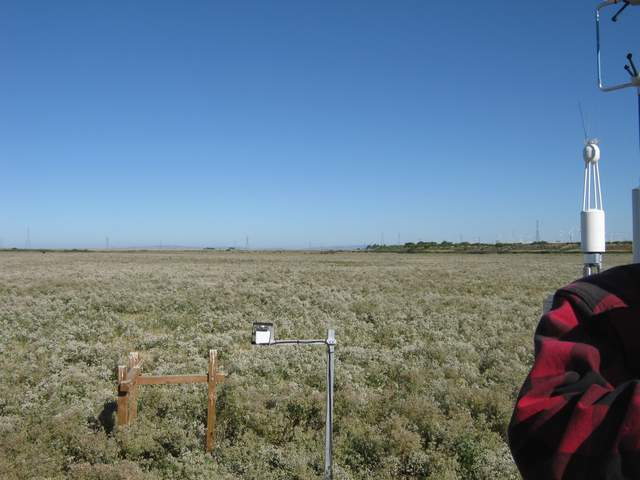
SI_autocam_20120607_0745.jpg ( 2012-06-07 07:45:03 ) Full size: 1920x1440
Joe working on tower swapping HMP45 fan
7 sets found
No data found for SI_mp.
11 SI_met graphs found
Can't check SI_mixed
2 SI_mixed graphs found
4 SI_flx graphs found
3 SI_soilco2 graphs found
Can't check TWSI_mixed
Can't check SIMBTWEE_met

