Field Notes
<--2012-05-31 12:30:00 | 2012-06-13 13:50:00-->Other sites visited today: Sherman Island | Mayberry | West Pond | DWR Corn
Phenocam link: Searching...
Twitchell Rice: 2012-06-07 12:30:00 (DOY 159)
Author: Joe Verfaillie
Others: Sara, Carina
Summary: Installed SHF plate, fixed water temperatures,the field looks very dry but rice and weeds coming up.
| Twitchell
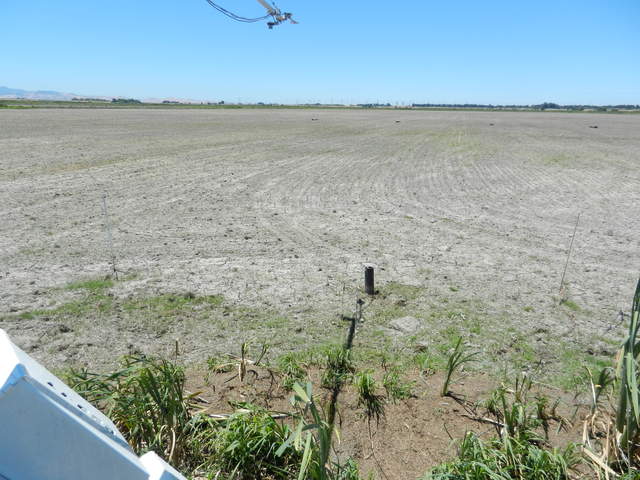
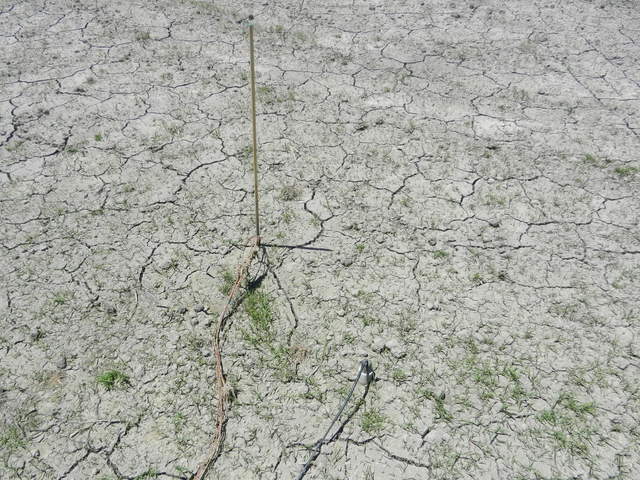
2012-06-07 I arrived about 12:30 with Sara and Carina. It was sunny and hot with a strong breeze from the west. The field looks drying than I ever remember seeing it. However there seems to be moisture just below the surface and weeds and rice are coming up in a green haze. There were four people there walking to field looking for archeological artifacts. I installed a soil heat flux plate (sn 00243) to replace the one cut off by a tractor. We also found and staked up the three water temperature thermocouples a few cm about the ground surface. I measured the well. The pipe extends 27cm above the ground and the well was dry at 76cm below the top of the pipe (39cm below ground). If the field is still dry next week we should probably re-dig the well. We collected all the data. The LI7700 RSSI was 29. After cleaning it was 72. I talked to Jim on the morning of 06-08 and he said the field may stay dry for a week and a half yet. |
3 photos found

20120607TW_Field.jpg ( 2012-06-07 13:10:16 ) Full size: 4000x3000
Dry rice field

20120607TW_GroundSensors.jpg ( 2012-06-07 13:09:59 ) Full size: 4000x3000
Ground sensors and cracked mud in the rice paddy

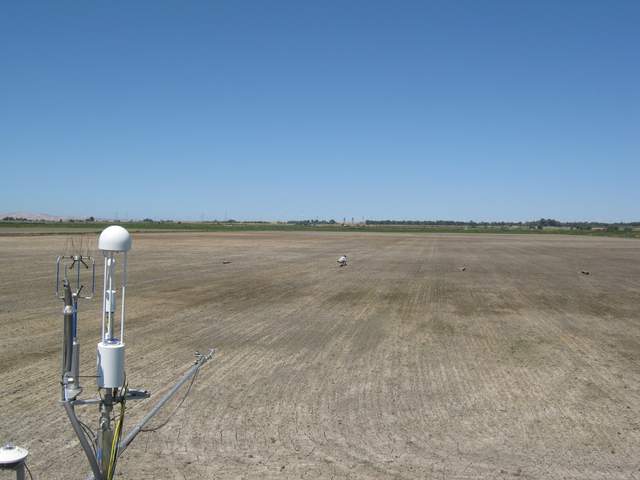
TW_autocam_20120606_1015.jpg ( 2012-06-06 10:15:02 ) Full size: 1920x1440
UC Davis on site
6 sets found
12 TW_met graphs found
5 TW_flux graphs found
Can't check TWSI_mixed
Can't check SIMBTWEE_met
1 TW_cam graphs found
Can't check TATWBABCSB_cam

