
Field Notes
<--2012-05-17 09:00:00 | 2012-05-31 13:30:00-->Other sites visited today: Sherman Island | Twitchell Rice | West Pond | DWR Corn
Phenocam link: Searching...
Mayberry: 2012-05-25 10:00:00 (DOY 146)
Author: Joe Verfaillie
Others:
Summary: Moved portable tower after cutting brake cable, brought in li7700 on portable tower for repair, collected data at both towers.
| Mayberry 2012-05-25 I arrived about 10:00PDT. It was cool and partly sunny with a good breeze. The portable tower was still running but the battery seemed a little low at 12.8V. The solar panel looked dusty with pollen. I cleaned the panel and the charging amperage increased from about 2A to about 4A. The li7700 wash reservoir was almost full. I tried to move the tower, but could not get the parking brake to release. After about an hour of pounding and prying, I cut a linkage in the brake cable just in front of the left rear wheel. This released the brake and I was able to move the tower. Back at the first location I carefully cleaned the Li7700 mirrors but was still getting an RSSI of almost zero. I called Licor and one of their technicians suggested that the spars may have come loose misaligning the path. This is sn TG1-0155 and had a misalignment when it first arrived from Licor. There is also a recall to improve weak mounts of the spars for older LI7700s. I brought it in to send to Licor for repair. In the lab I could actually see where the spars had slipped a little. The portable tower is still running collecting CO2 and H2O flux. When I left it the solar system was reading 13.4V, 5.6A solar, .07A load. I swapped the USB drive and moved the data to the netbook. At the main tower I collected data from the Tule tower, swapped the USB drive on the LI7550 and moved the data to the netbook and moved the camera images to the netbook. The clocks seemed to be okay. The RSSI was about 40. After cleaning it was 68. The wash reservoir was almost full. A large meter long garter snake was in the grass under the tower. |
4 photos found
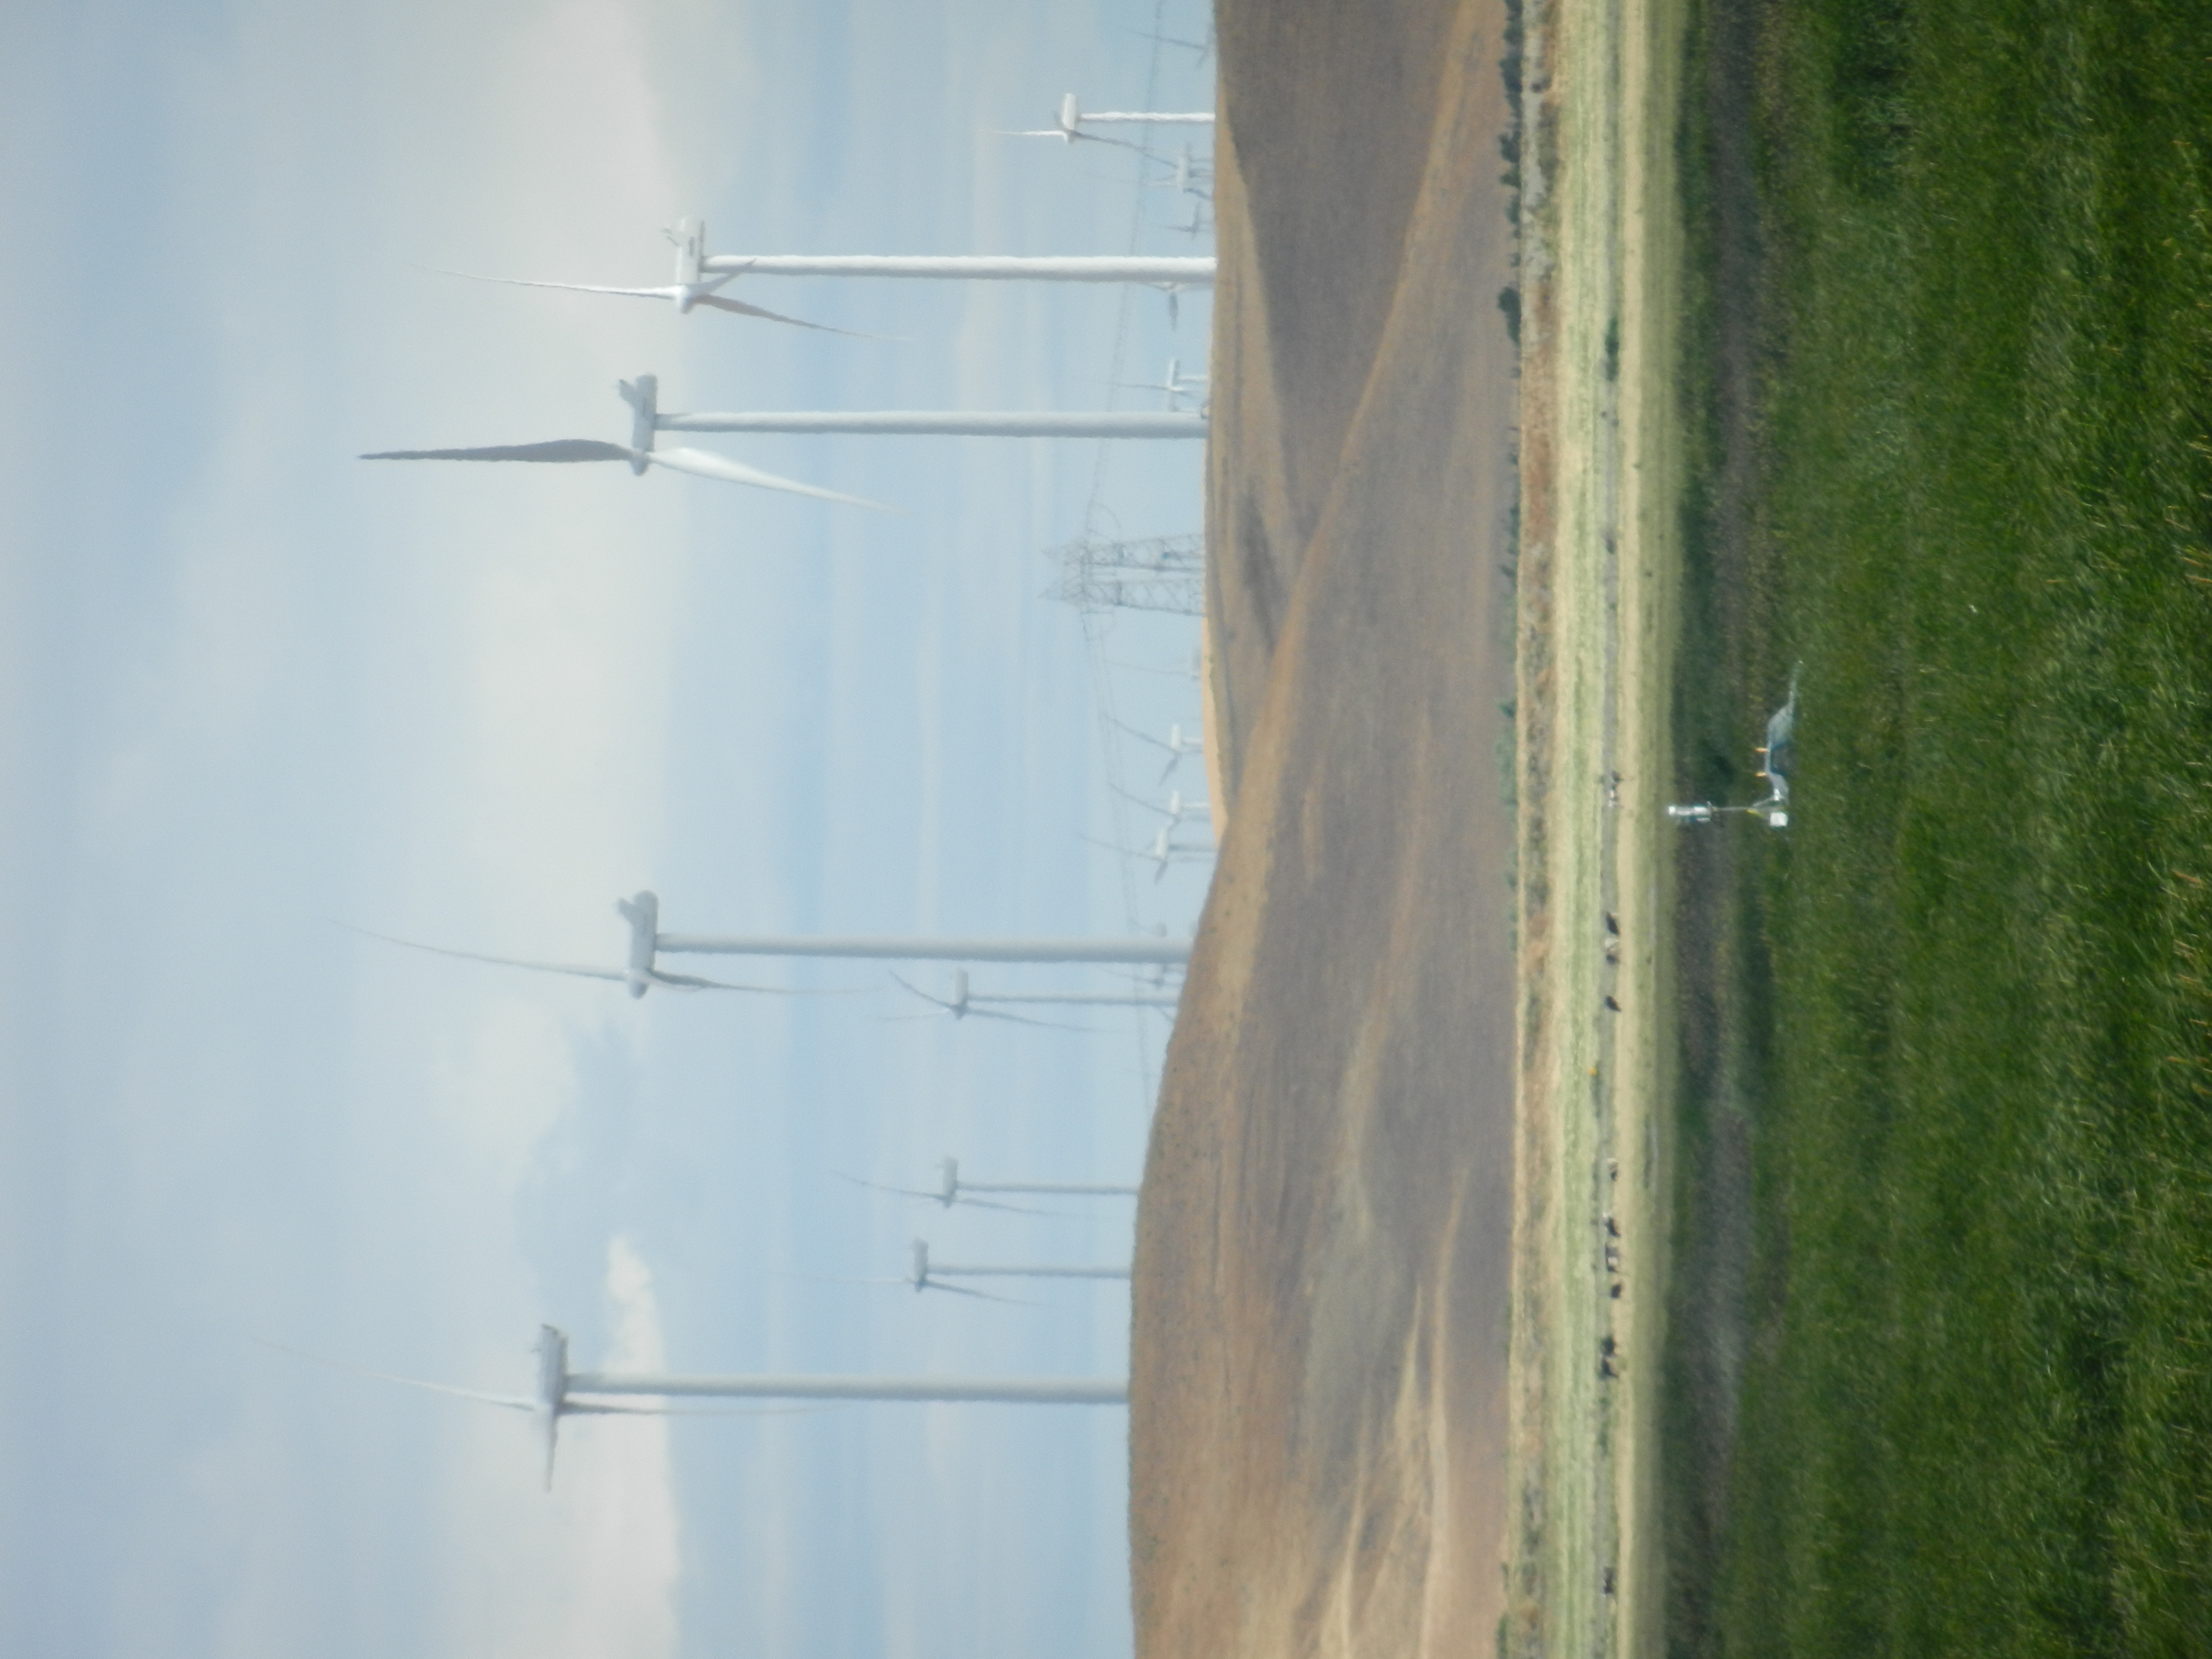
20120525MB_PTSite2.jpg ( 2012-05-25 09:55:52 ) Full size: 4000x3000
Our tower is dwarfed by the wind turbines in the background
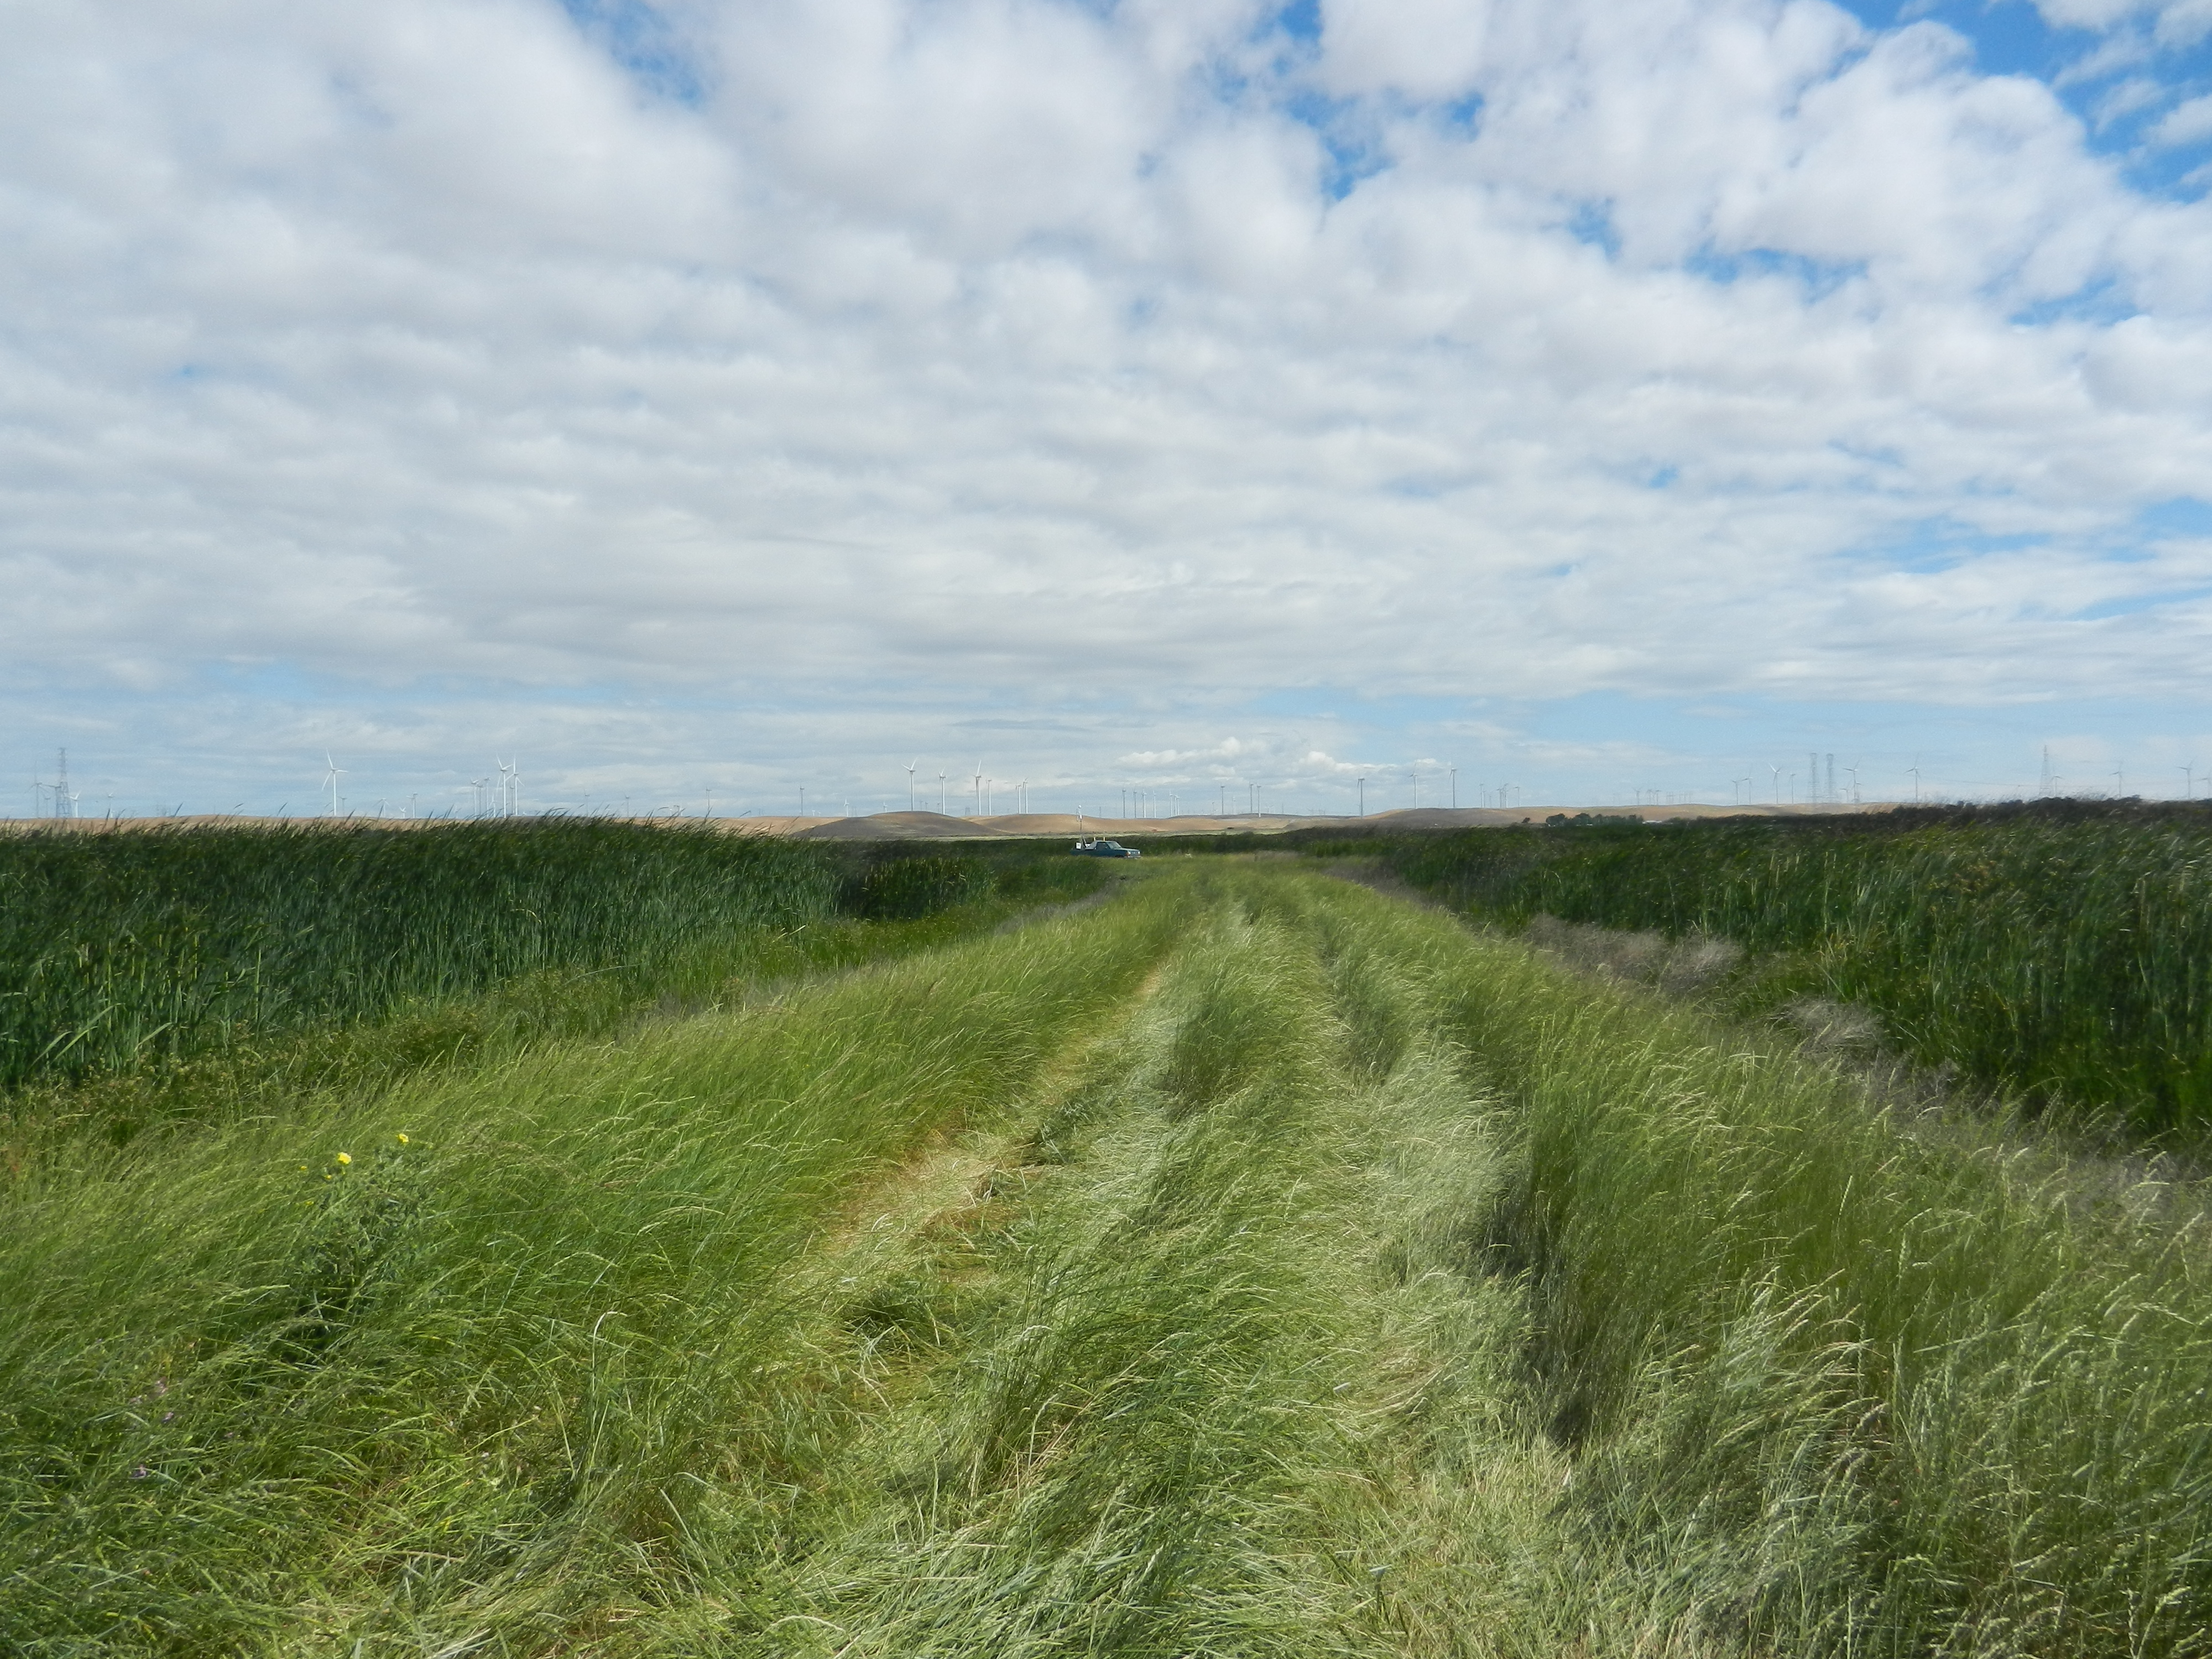
20120525MB_PTSite2Approach.jpg ( 2012-05-25 10:04:43 ) Full size: 4000x3000
Grassy levee road approaching the portable tower location #2
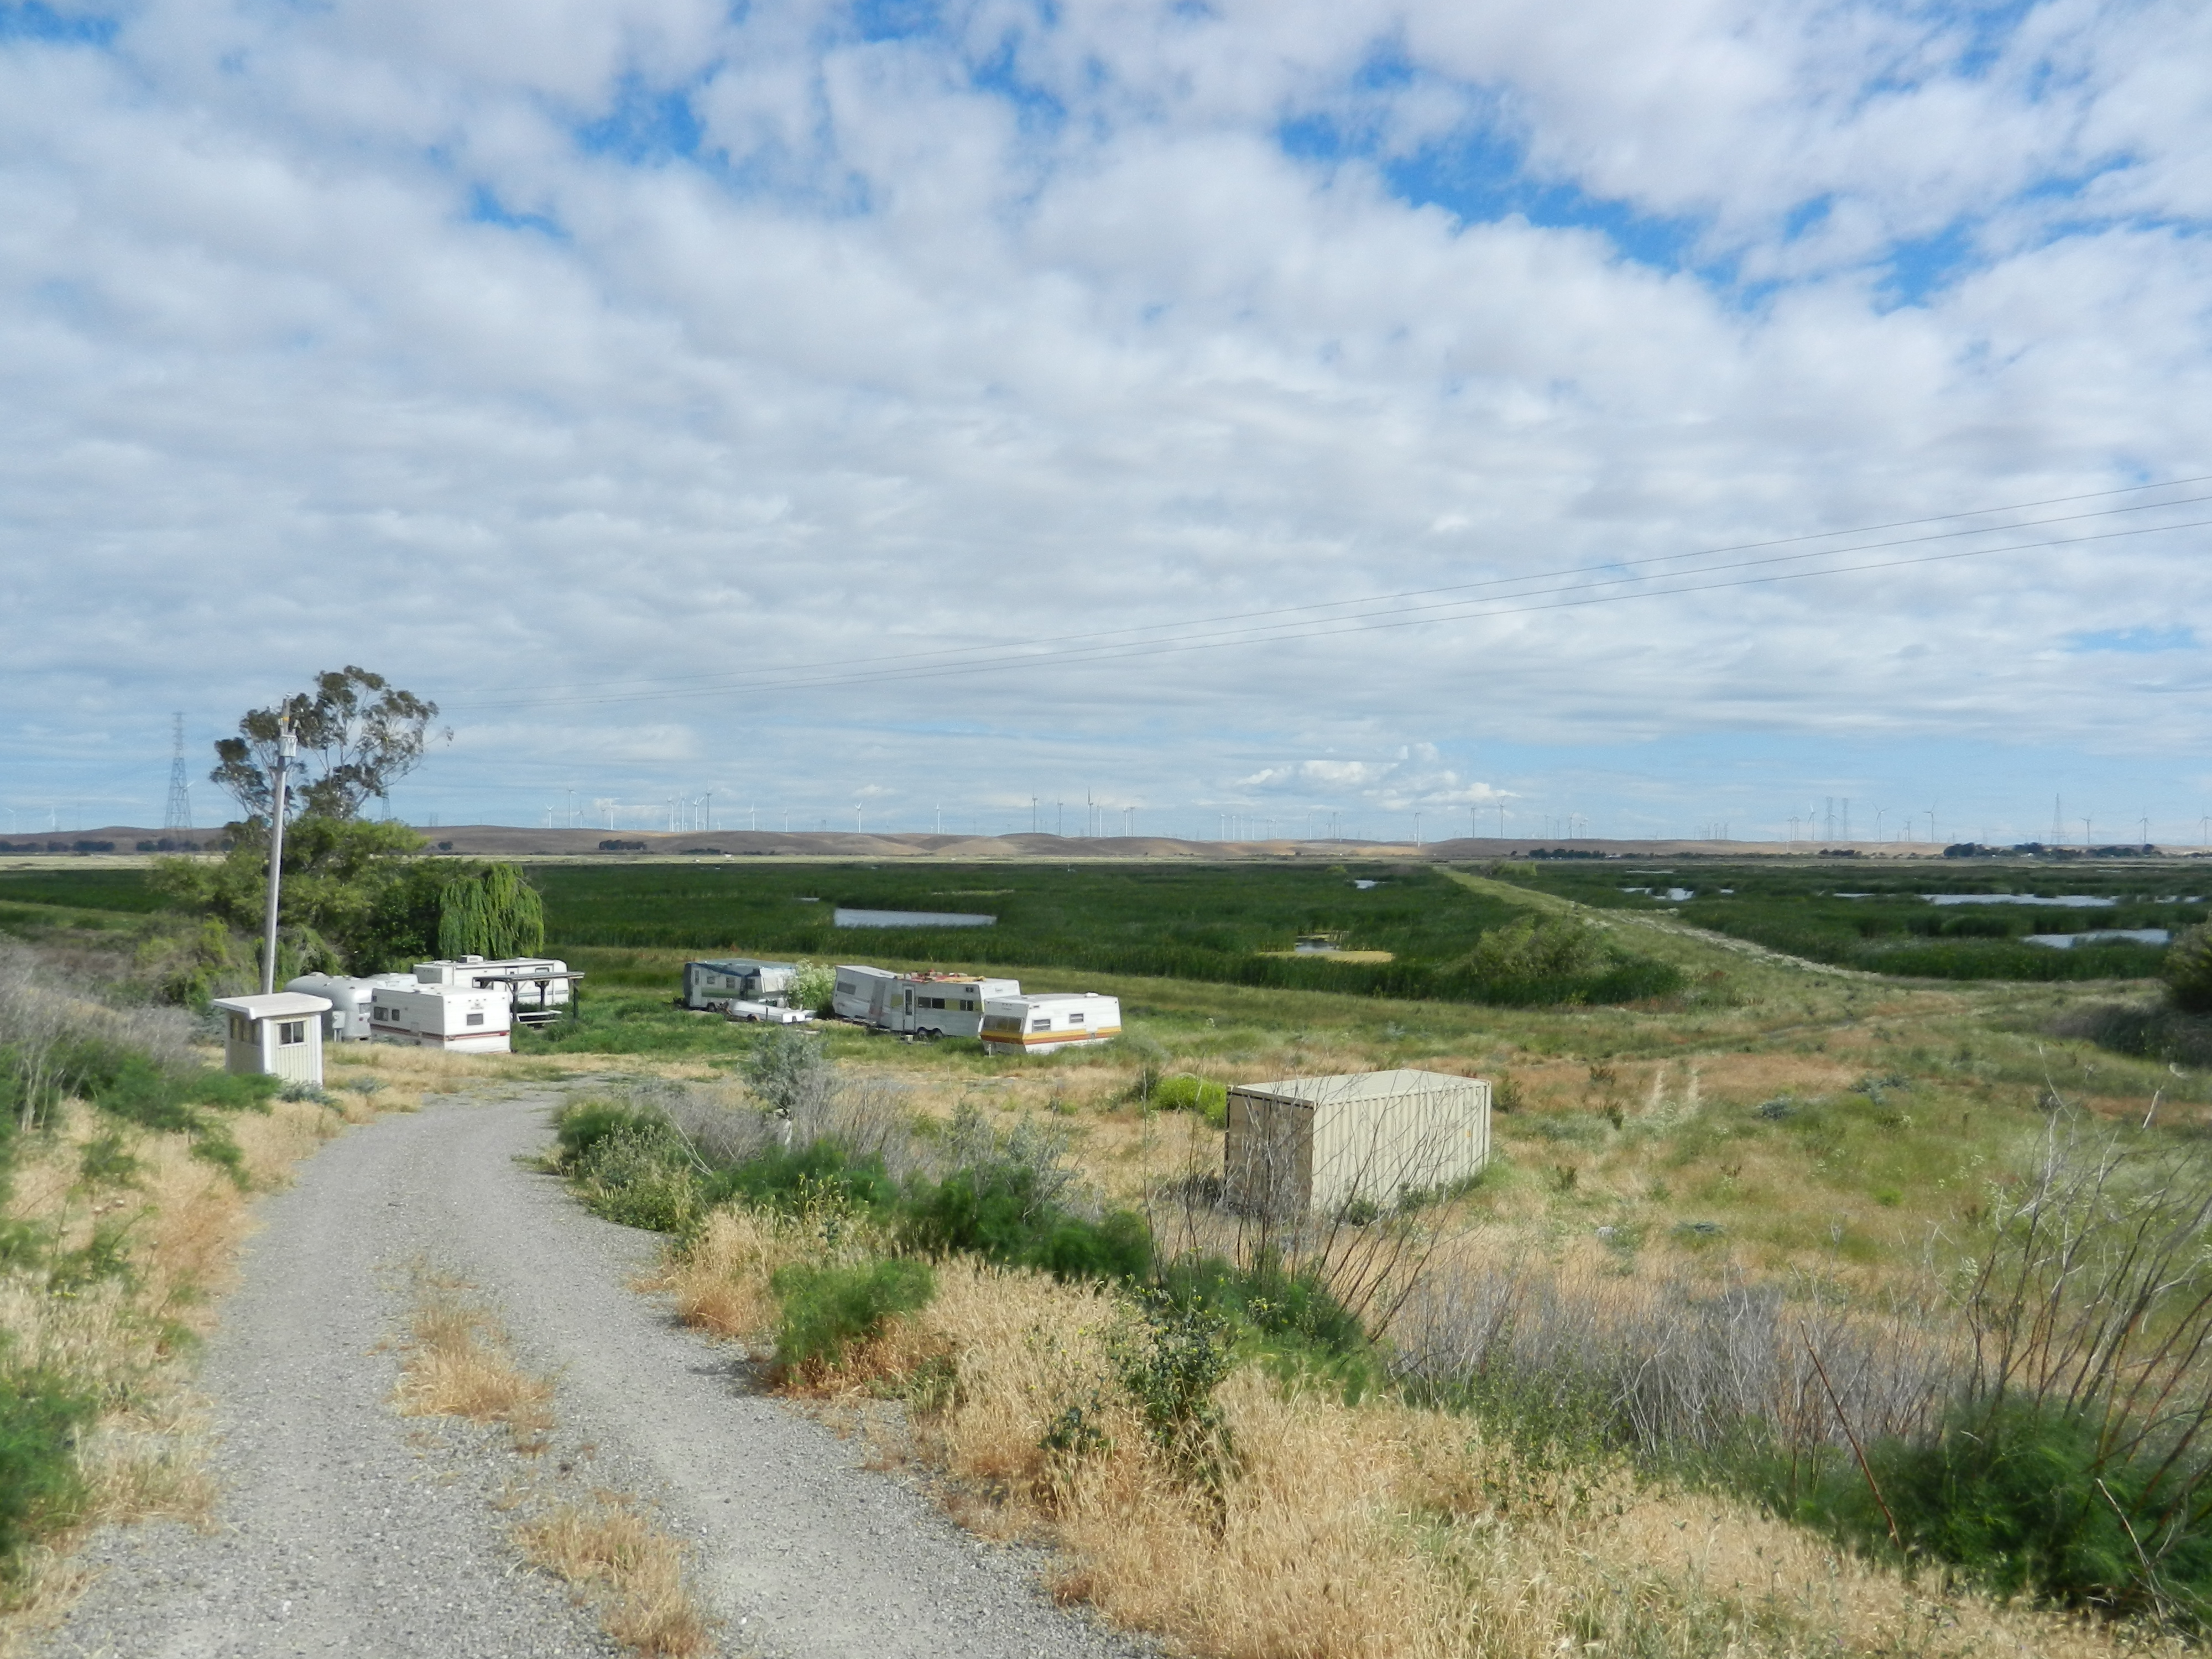
20120525MB_Trailers.jpg ( 2012-05-25 09:55:25 ) Full size: 4000x3000
Trailers just off of the gravel levee road

MB_autocam_20120525_1245.jpg ( 2012-05-25 12:45:03 ) Full size: 1920x1440
Joe on Site
11 sets found
7 MB_flux graphs found
No data found for MB_met.
28 MB_tule graphs found
Can't check MBWPEESWGT_mixed
1 MB_cam graphs found
Can't check MBEEWPSWEPGT_cam
Can't check SIMBTWEE_met
No data found for MB_minidot.
Can't check MBSWEEWPBCBA
1 MB_processed graphs found
Can't check MB_fd
1 MB_fd graphs found