
Field Notes
<--2009-07-01 12:00:00 | 2009-07-10 08:00:00-->Other sites visited today: Sherman Island | Sherman Island
Phenocam link: Searching...
Twitchell Rice: 2009-07-09 08:30:00 (DOY 190)
Author: Joe Verfaillie
Others: Dennis, Ben
| Twitchell
7/9/2009 Arrived about 8:30 with Dennis and Ben. Clear, sunny, breeze, cool. Setup LGR system. Swapped card before uploading new program to CR1000. TW_CR1kFlux_v3.CR1. This program has new order of columns based on discussions with Matteo: Table: SI_Fast Interval: 100 MSEC Fields: U Units: m/s V Units: m/s W Units: m/s sos Units: m/s lgr_sec Units: sec lgr_ch4 Units: ppm li_co2 Units: mmol/m^3 li_h2o Units: mmol/m^3 Table: SI_Slow Interval: 30 MIN Fields: batt_volt_Avg PTemp_Avg U_Avg Units: m/s V_Avg Units: m/s W_Avg Units: m/s sos_Avg Units: m/s lgr_ch4_Avg Units: ppm lgr_p_Avg Units: Torr lgr_t_Avg Units: C lgr_ring_Avg Units: usec lgr_cal_Avg Units: none li_co2_Avg Units: mmol/m^3 li_h2o_Avg Units: mmol/m^3 li_p_Avg Units: kPa li_t_Avg Units: C li_cooler_Avg Units: V li_diag Units: none li_band_Avg Units: Hz li_delay Units: 6.579ms Moved three huge batteries from Steve to tower site. Met Jim and Bruce at recirculation pump generator. Seems the generator runs 24/7 expect for maintenance once every three weeks. And we could pull up to two 20A lines from it for our tower. Distance and cost of wire tradeoff. Matteo arrived about 2pm to continue LGR measurements until about 6pm. |
4 photos found
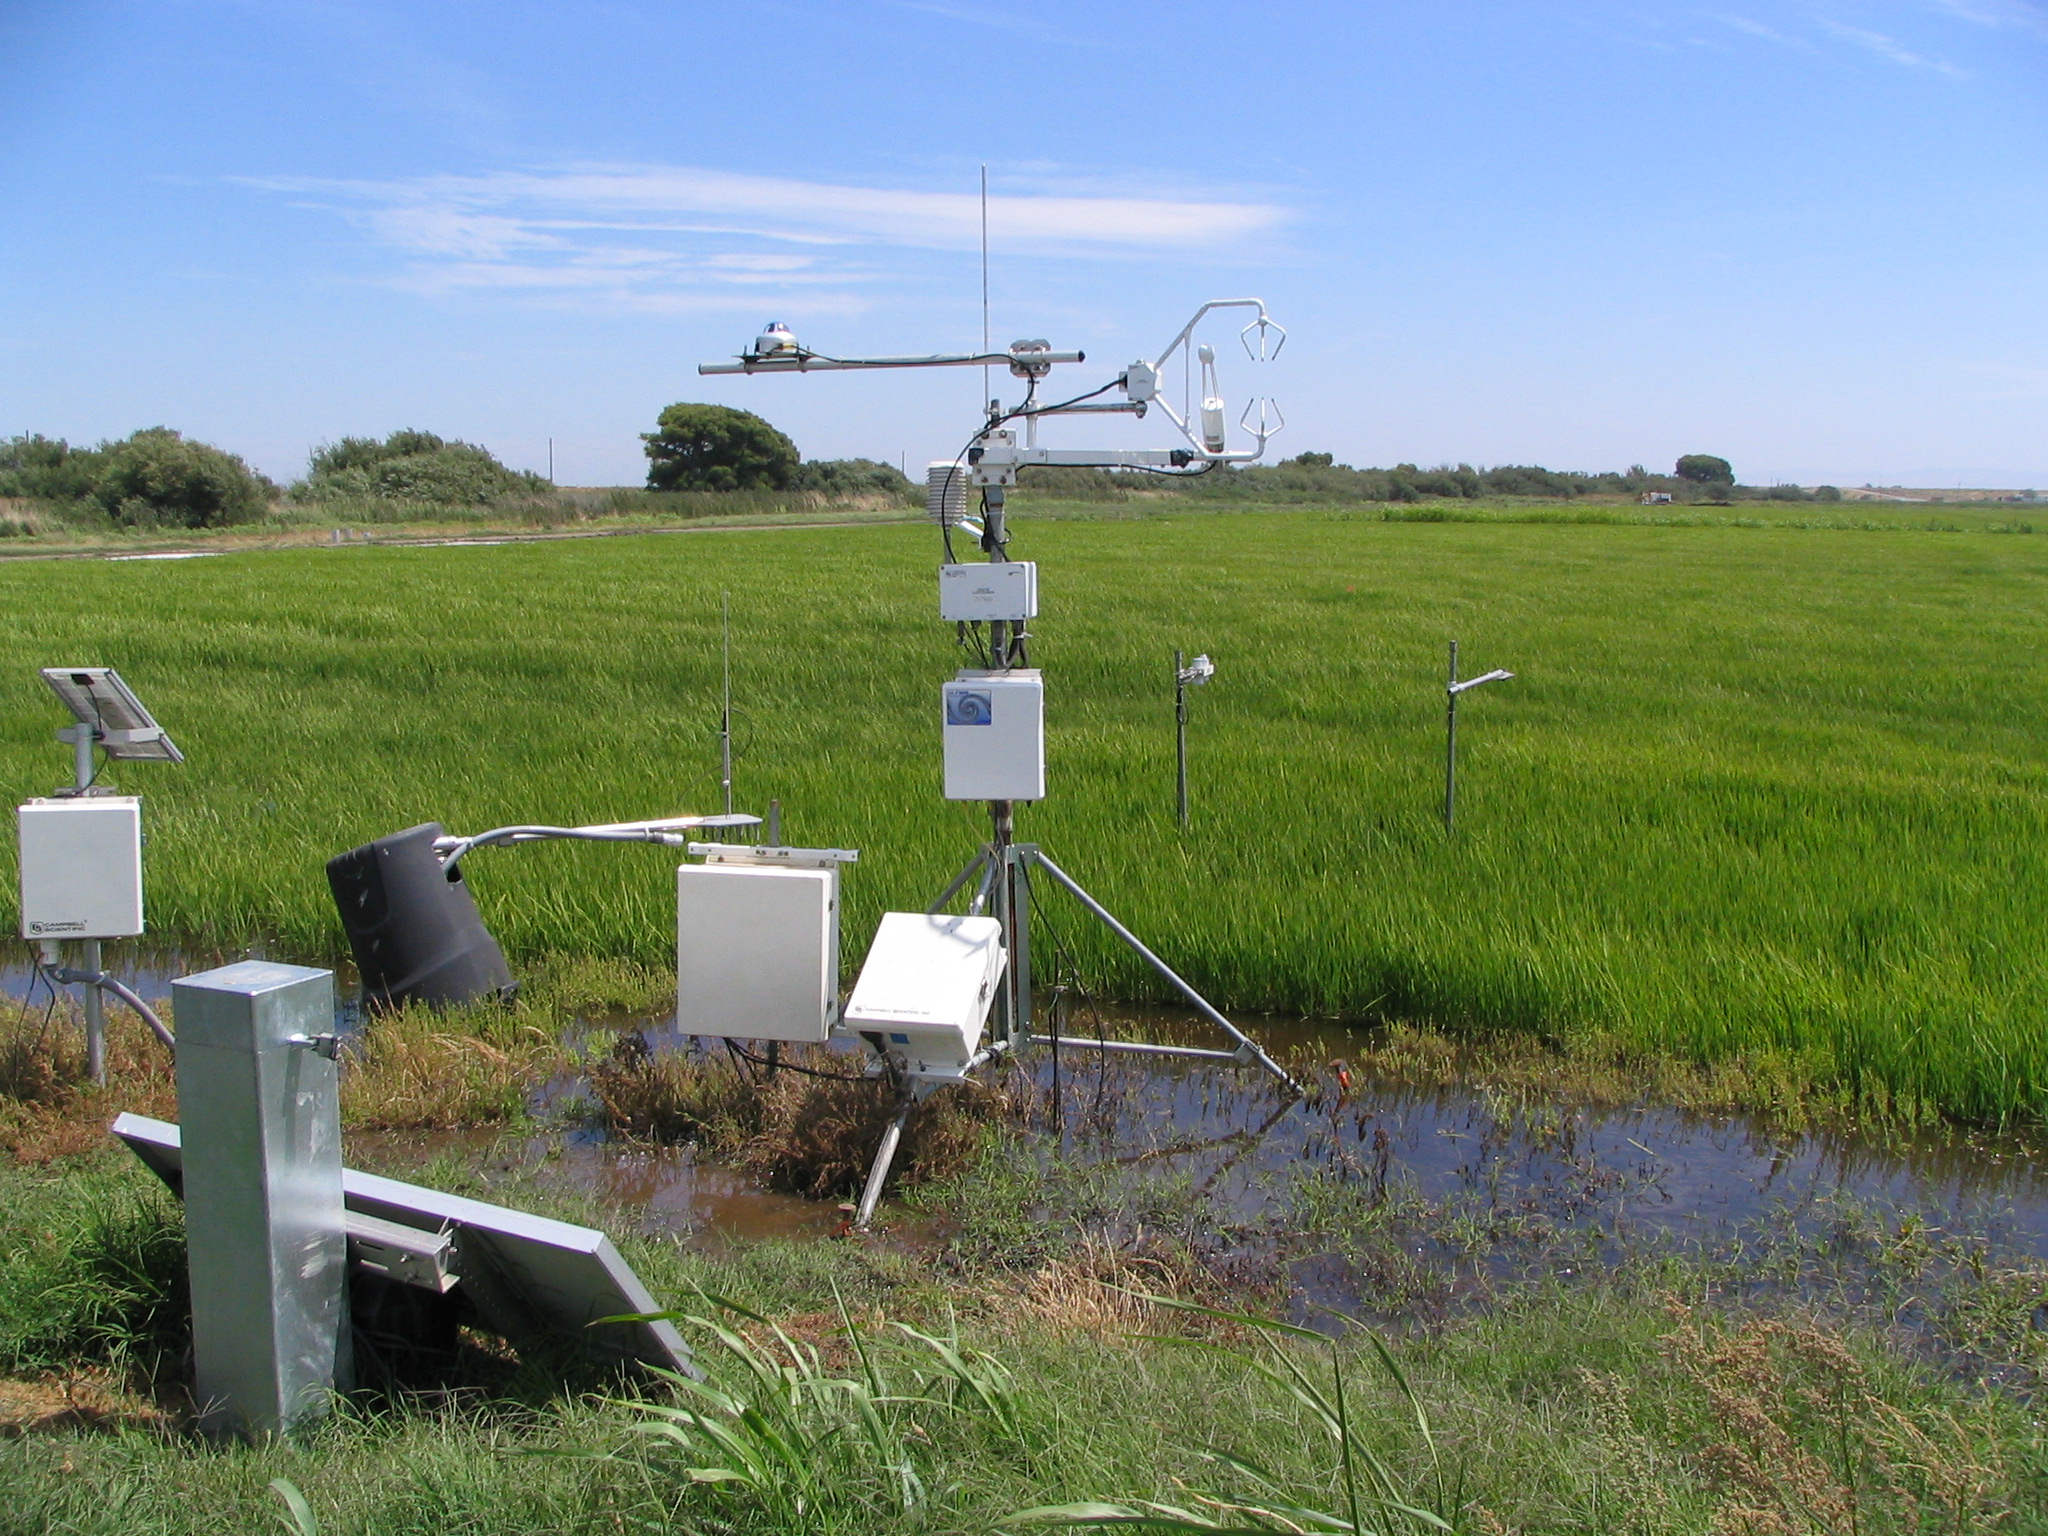
20090710TW_FranksTowerSE.jpg ( 2009-07-10 14:25:05 ) Full size: 2048x1536
USGS eddy tower at the rice field
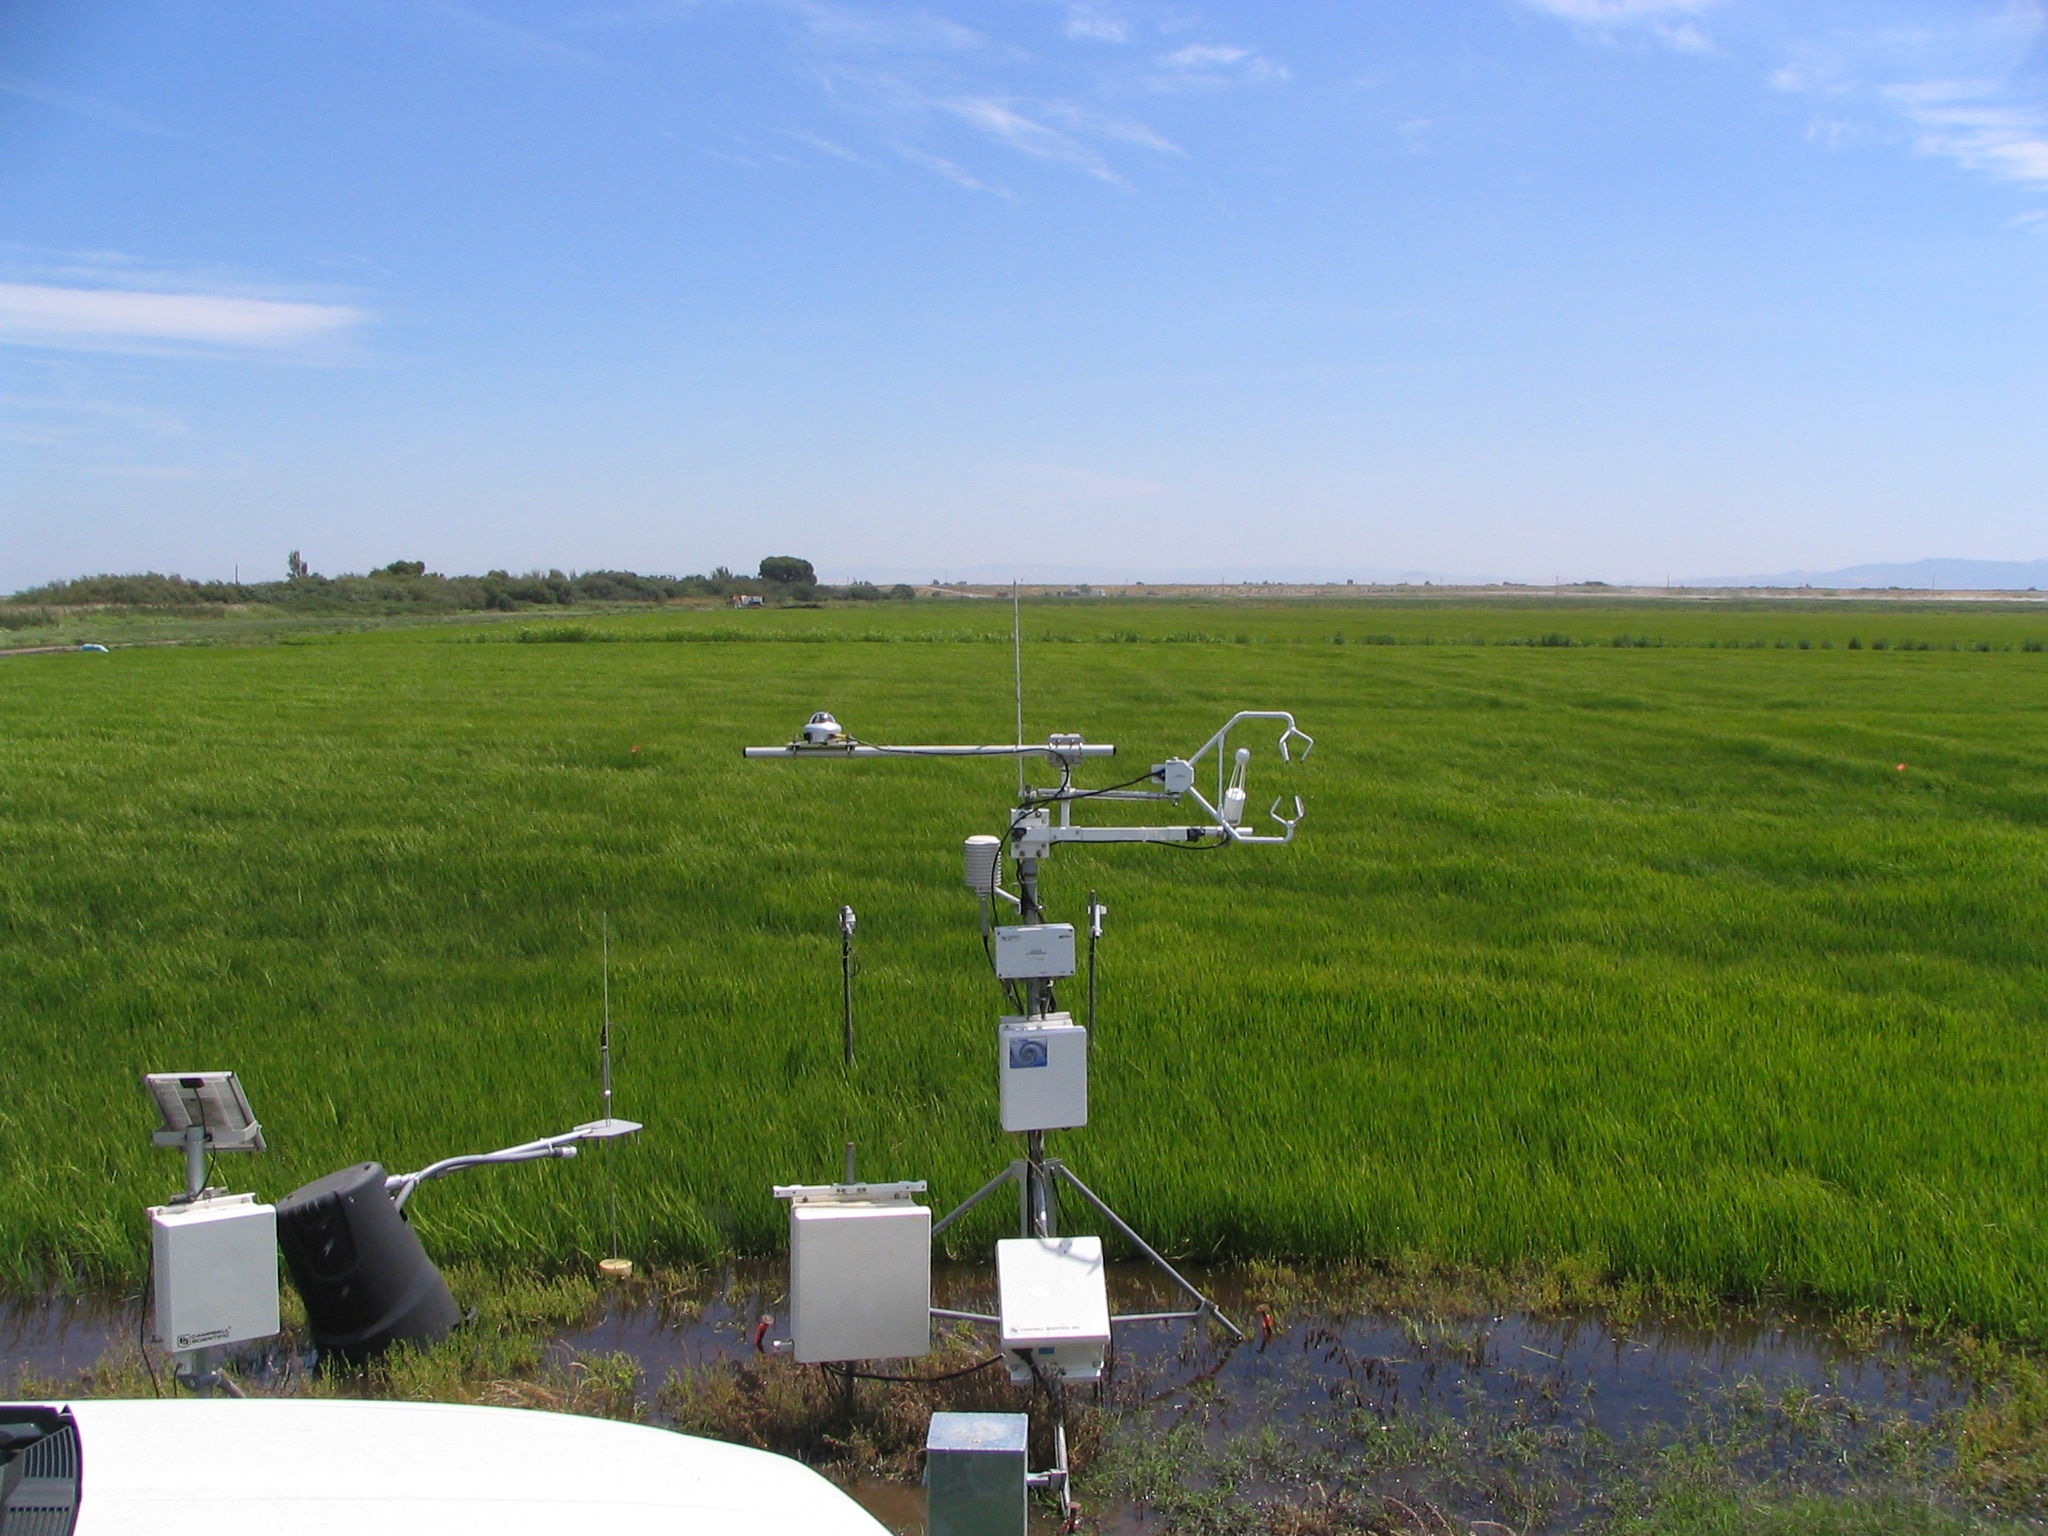
20090710TW_FranksTowerSouth.jpg ( 2009-07-10 14:24:50 ) Full size: 2048x1536
USGS eddy tower at edge of flooded rice paddy
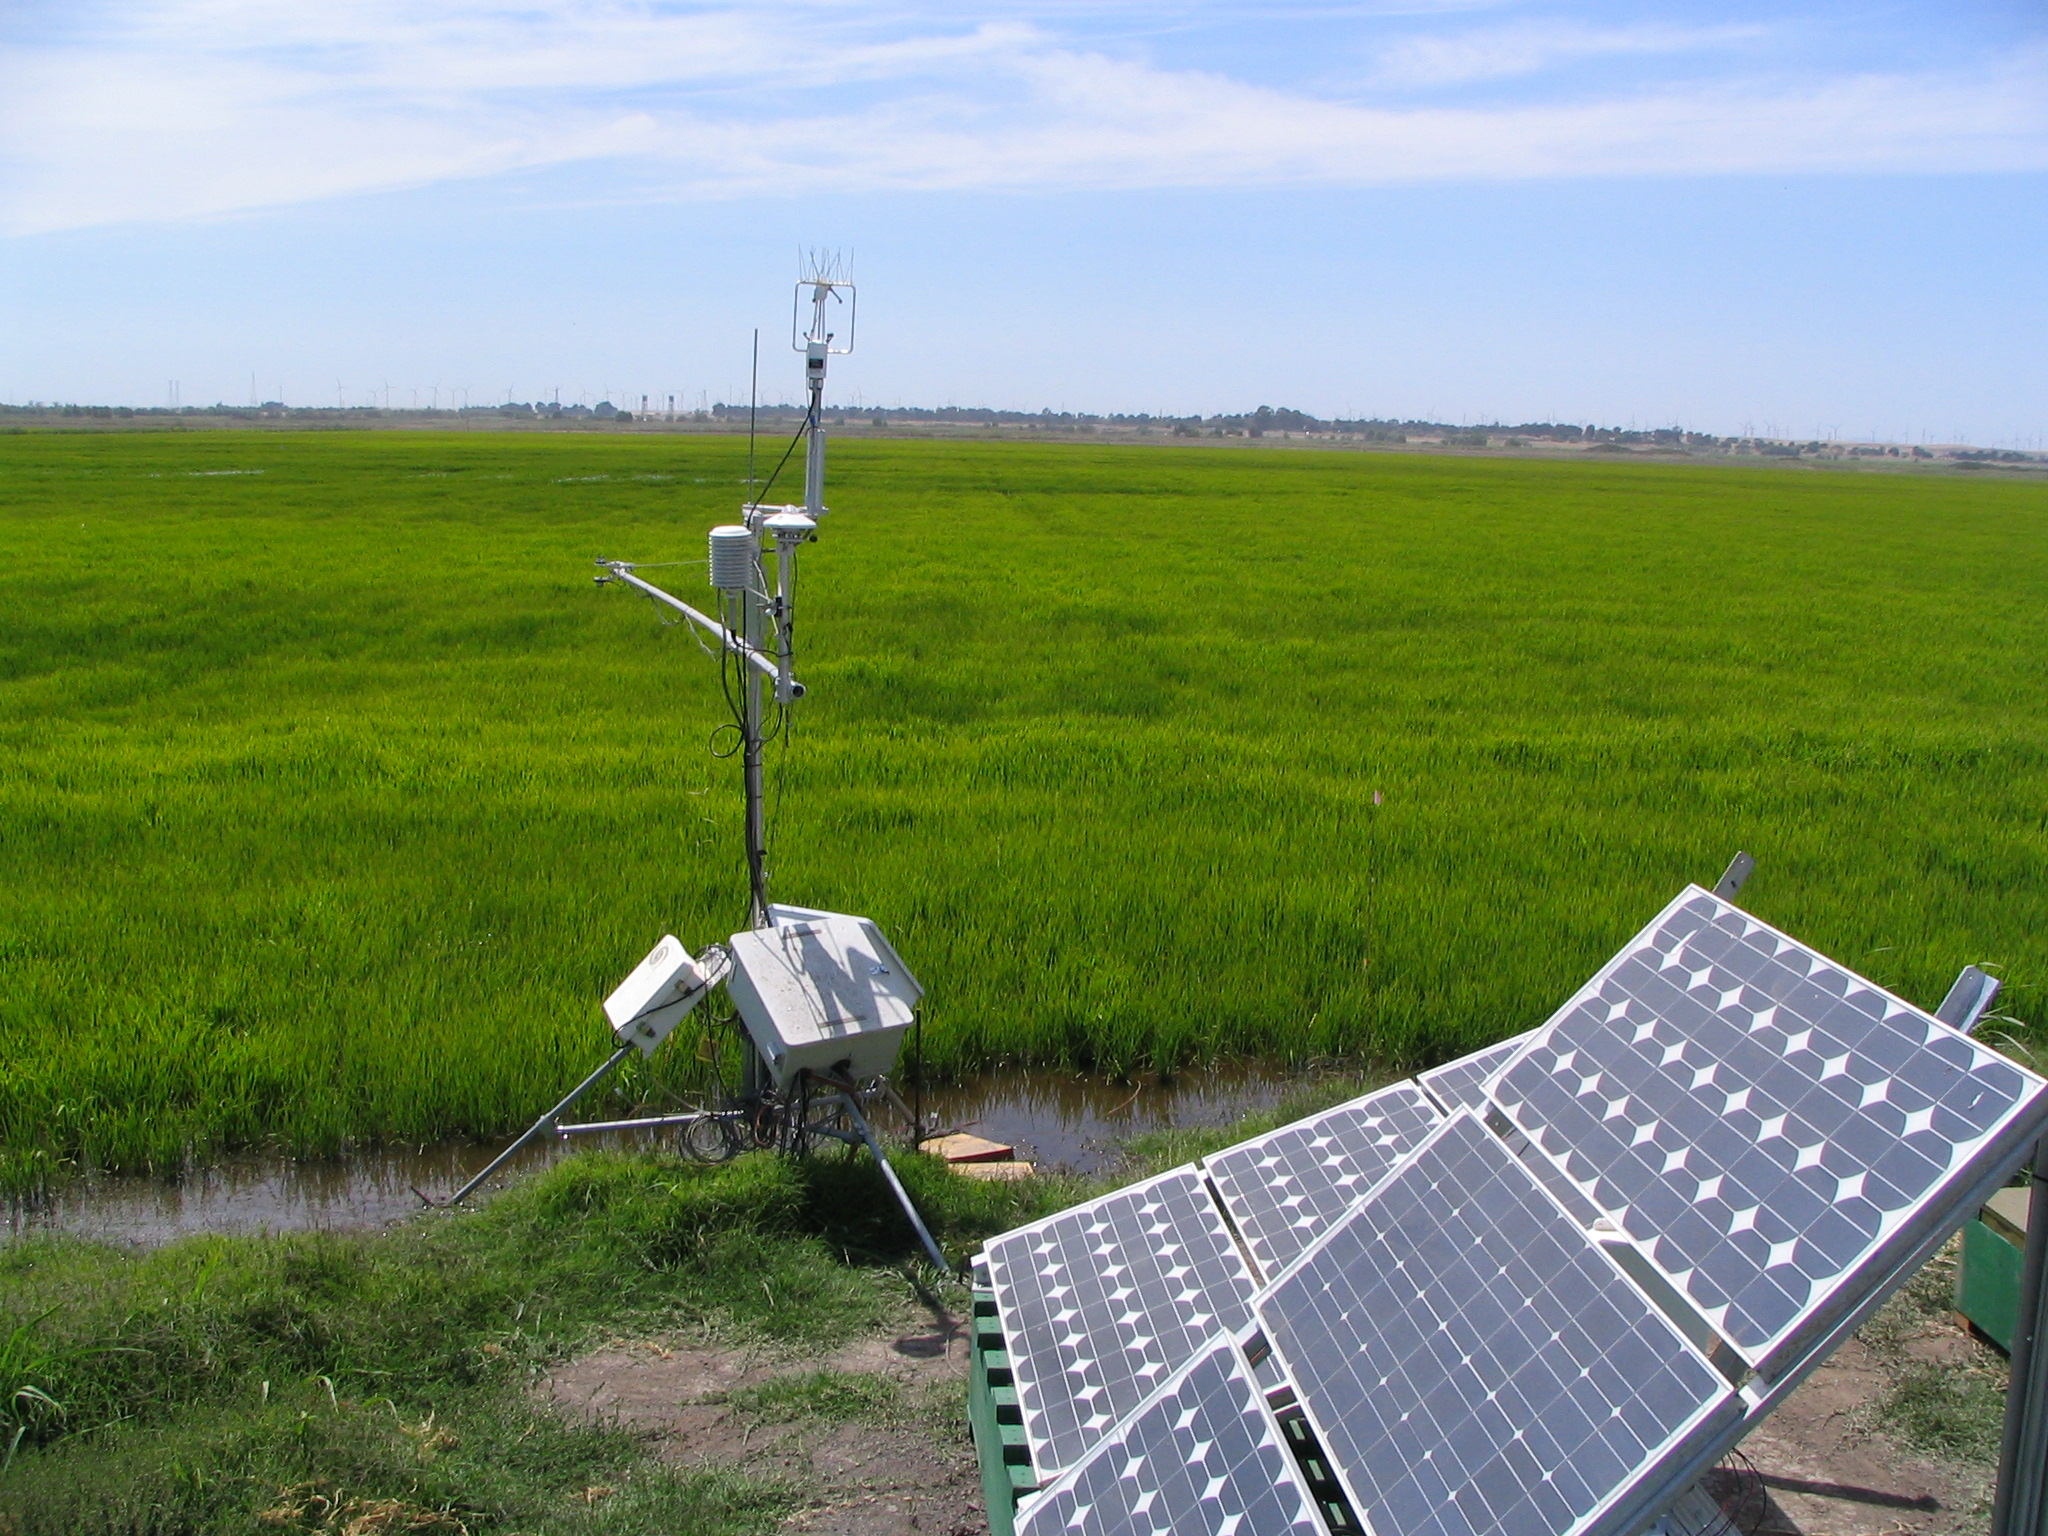
20090710TW_SolarTower.jpg ( 2009-07-10 14:24:56 ) Full size: 2048x1536
Solar panels and eddy tower on edge of rice field
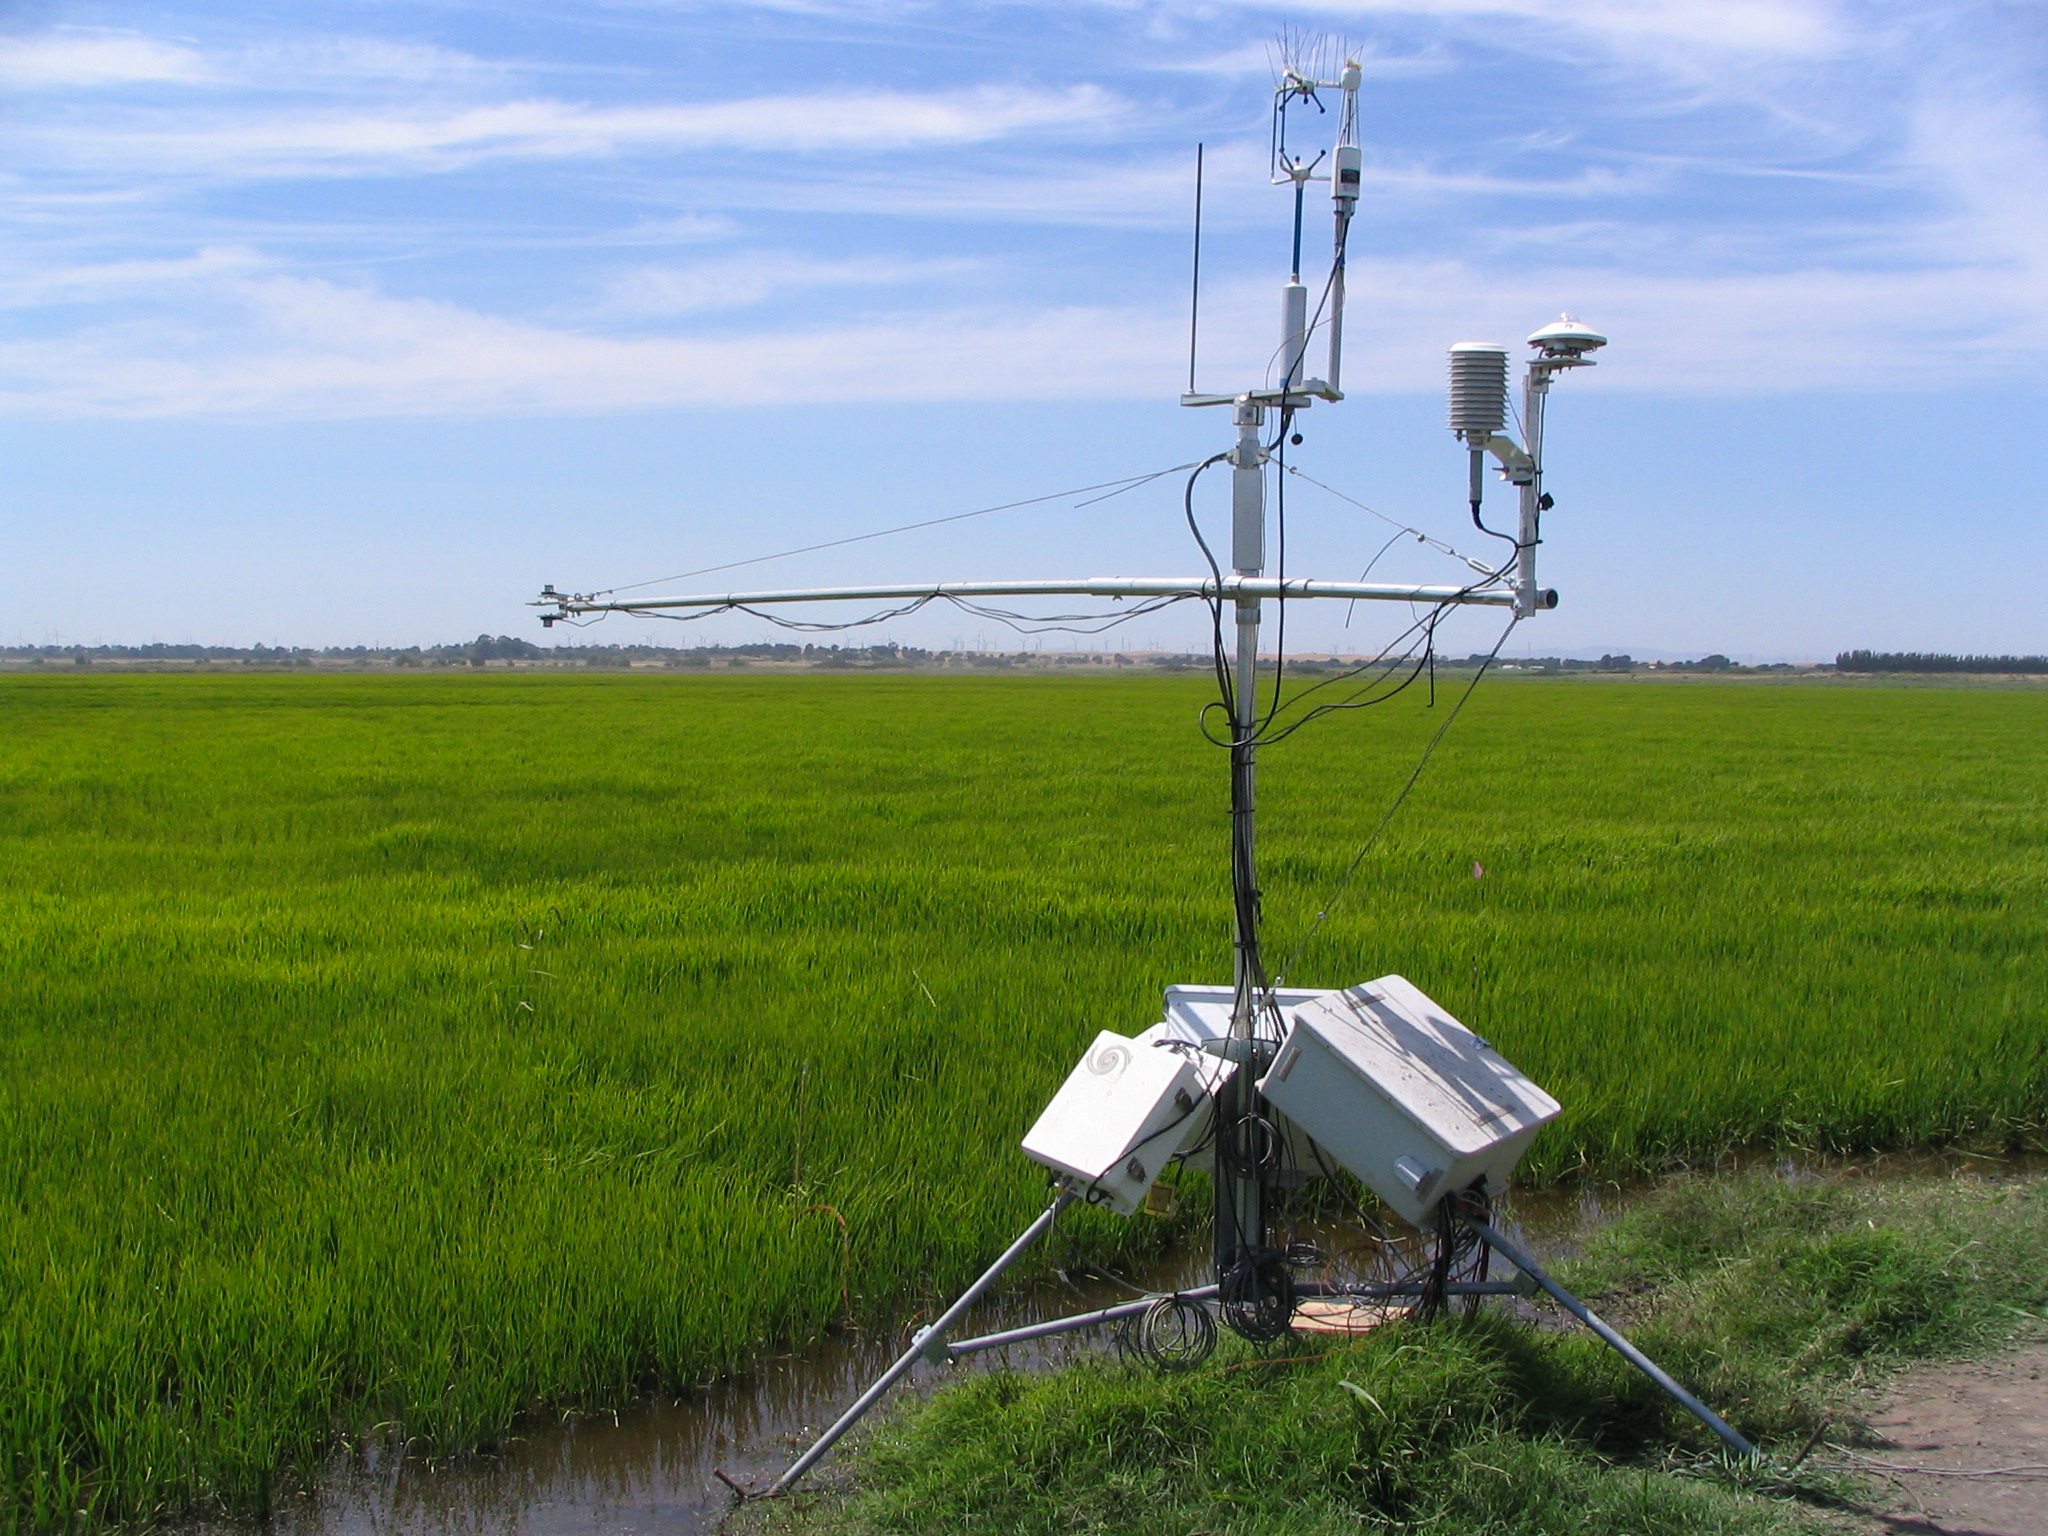
20090710TW_Tower.jpg ( 2009-07-10 14:25:13 ) Full size: 2048x1536
Rice eddy tower on the edge of the field
6 sets found
12 TW_met graphs found
5 TW_flux graphs found
Can't check TWSI_mixed
Can't check SIMBTWEE_met
1 TW_cam graphs found
Can't check TATWBABCSB_cam