
Field Notes
<--2012-01-25 07:30:00 | 2012-02-15 09:00:00-->Other sites visited today: Mayberry | Twitchell Rice
Phenocam link: Searching...
Sherman Island: 2012-01-31 11:00:00 (DOY 31)
Author: Joe Verfaillie
Others: Sara, Jaclyn
Summary: Talked to Walt, fixed(?) ref temp for soil CO2.
| Sherman
2012-01-31 I arrived with Jaclyn and Sara about 11am. It was warm, clear and sunny with little wind and fog here and there. The cows are hanging out near the tower because they are getting fed there. We had to chase them away from the wells to make those measurements. We talked to Walt. He said he will be staking bales near the gate again. He Also said that saw the guys that probably took our fence charger and that he lost one too. Walt also said the outer gate is being closed again and all the locks are in place. Our older key fits a faded orange lock. We collected data, all looked okay. The ref temperature for the soil CO2 sensors was just hanging in the box. I taped it to the AM416 body. After downloading the data from the CR10X I updated the program to use the ref temperature instead of the panel temperature. |
3 photos found
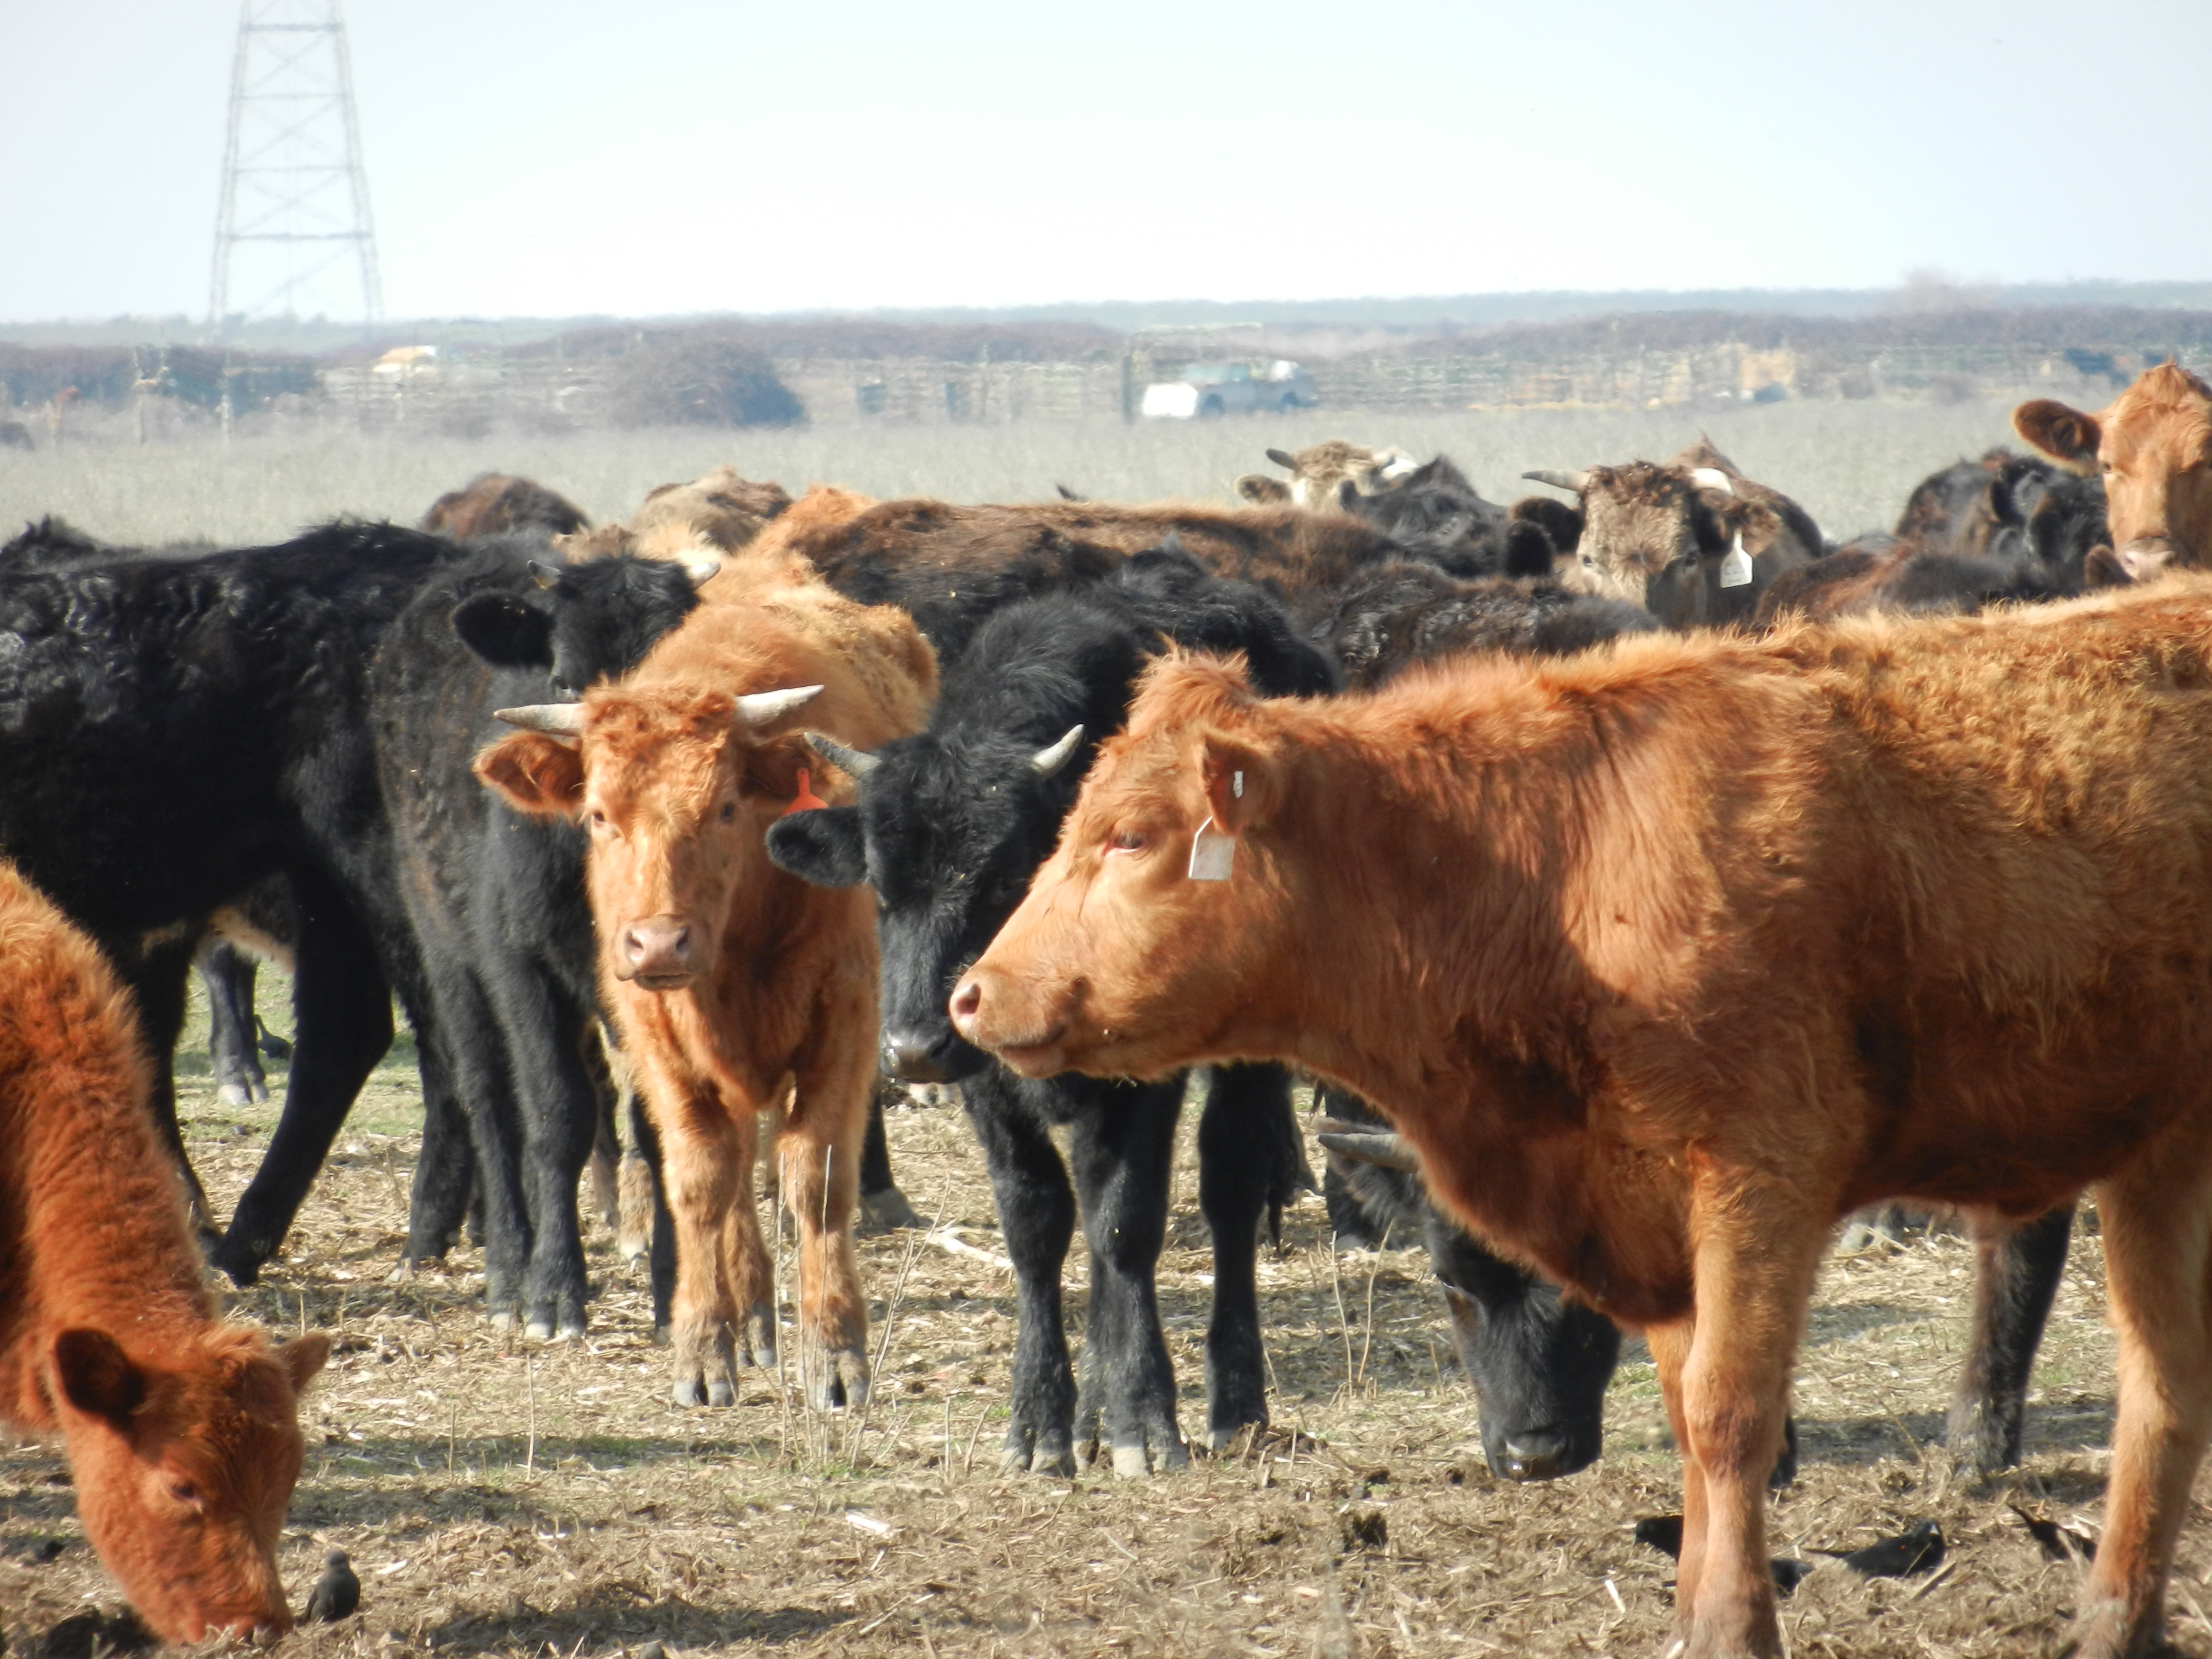
20120131SI_Cows.jpg ( 2012-01-31 12:57:21 ) Full size: 4000x3000
Cow herd eating hay
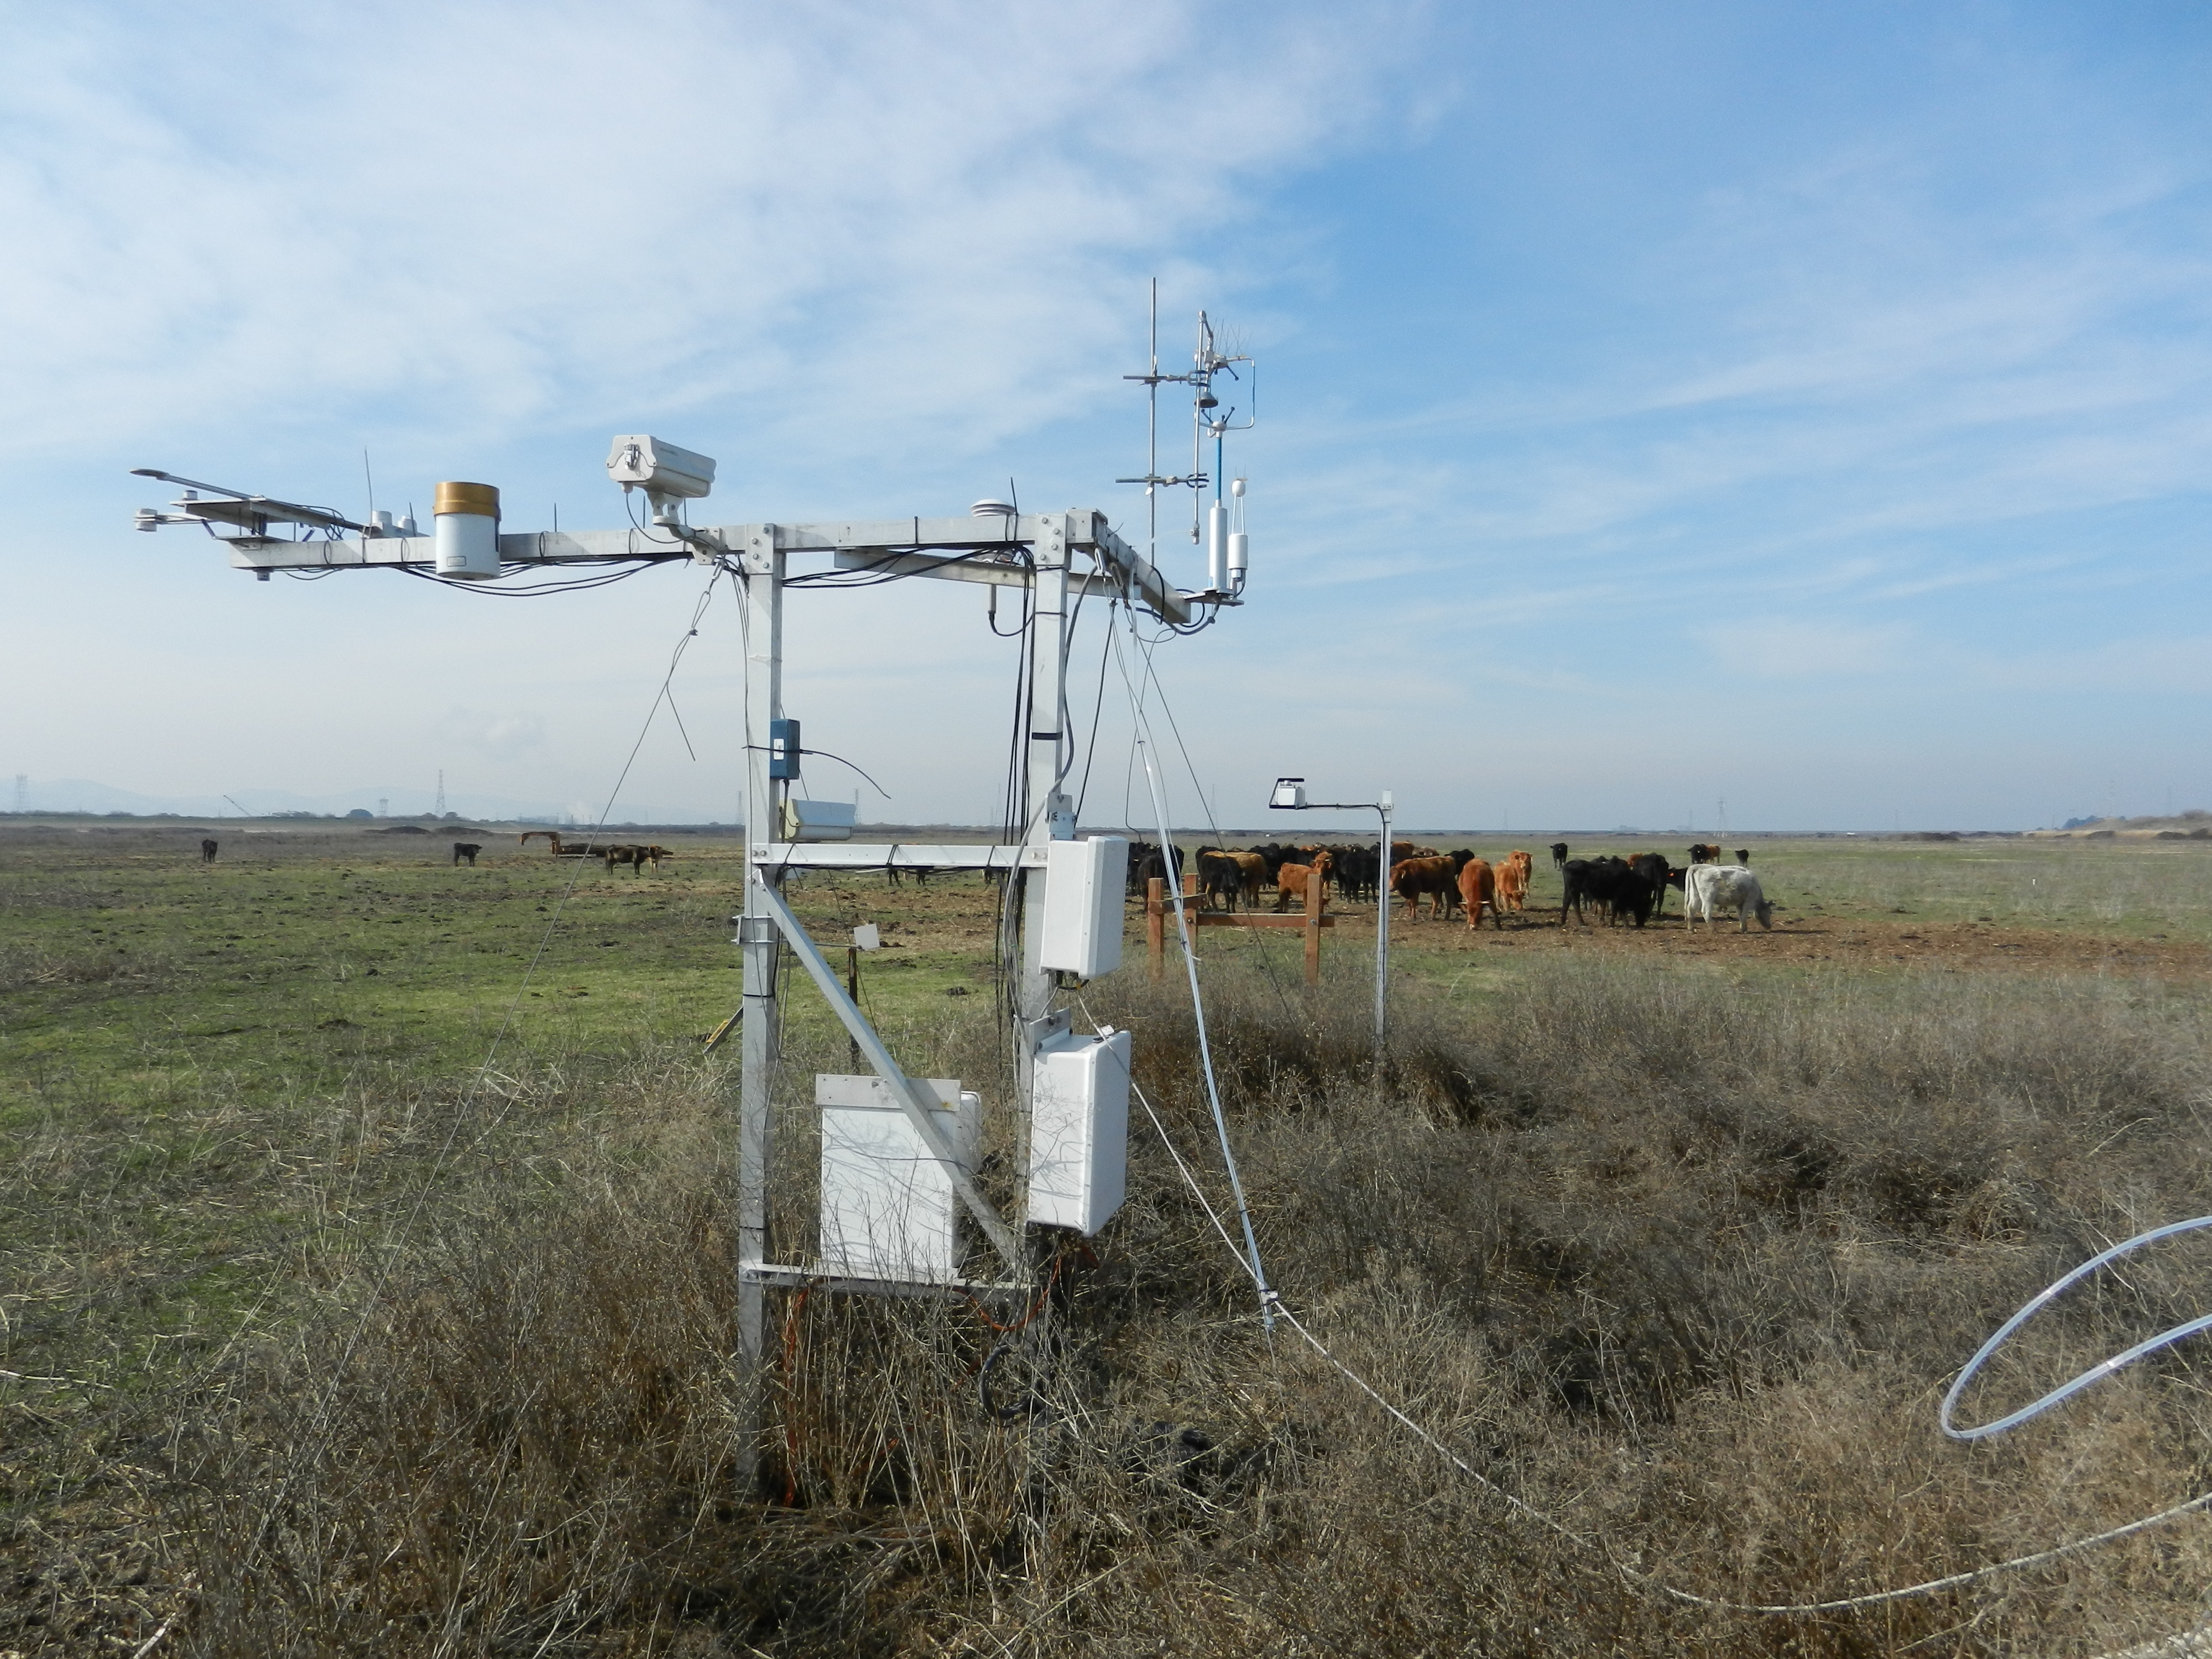
20120131SI_CowsTower.jpg ( 2012-01-31 12:57:40 ) Full size: 4000x3000
Cows recently fed behind the eddy tower
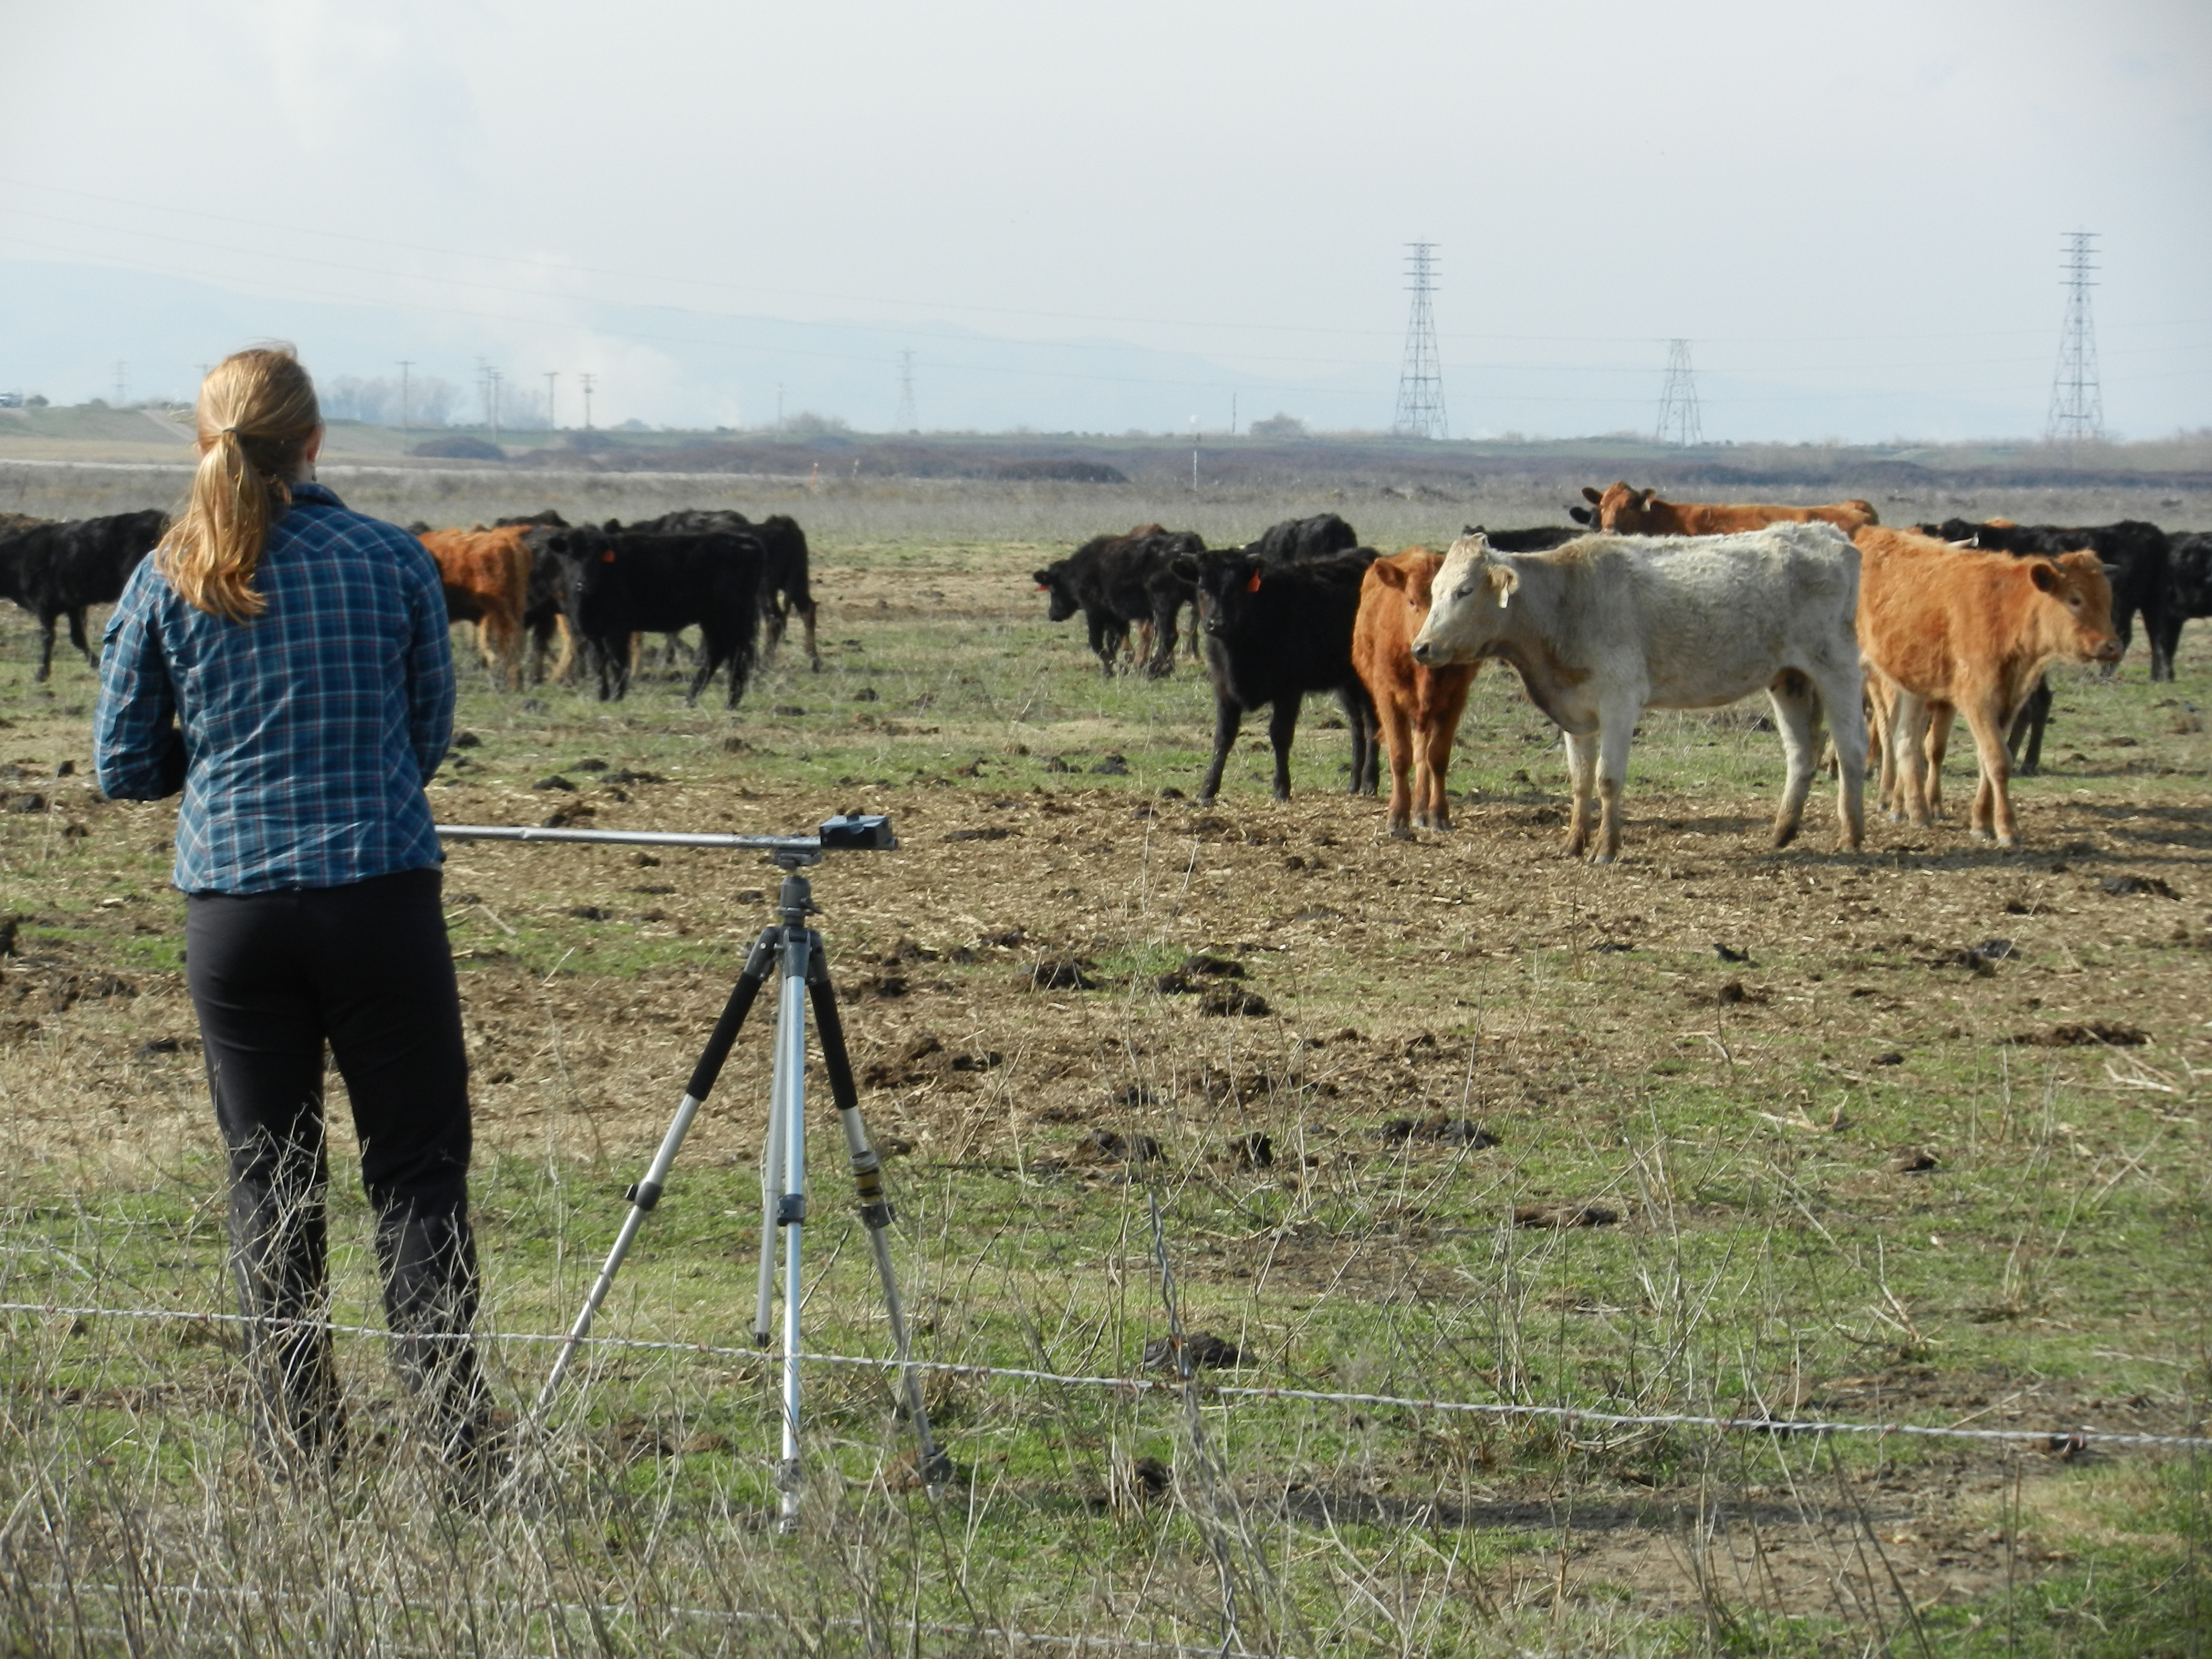
20120131SI_JaclynCows.jpg ( 2012-01-31 12:46:41 ) Full size: 4000x3000
Jaclyn doing spectral measurements near hungry cows
7 sets found
No data found for SI_mp.
11 SI_met graphs found
Can't check SI_mixed
2 SI_mixed graphs found
5 SI_flx graphs found
2 SI_soilco2 graphs found
Can't check TWSI_mixed
Can't check SIMBTWEE_met