Field Notes
<--2012-01-31 11:00:00 | 2012-02-28 10:00:00-->Other sites visited today: Twitchell Rice | Mayberry
Phenocam link: Searching...
Sherman Island: 2012-02-15 09:00:00 (DOY 46)
Author: Joe Verfaillie
Others:
Summary: Super windy, swapped charge controller, installed LI7700, swapped card reader on CR1000, CR1000 program changed.
| Sherman
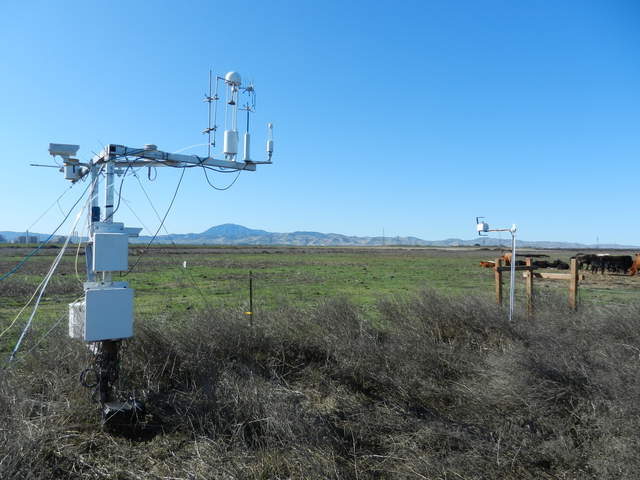
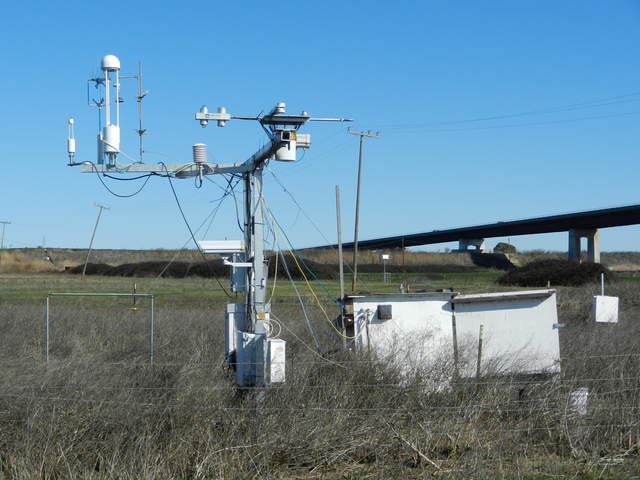
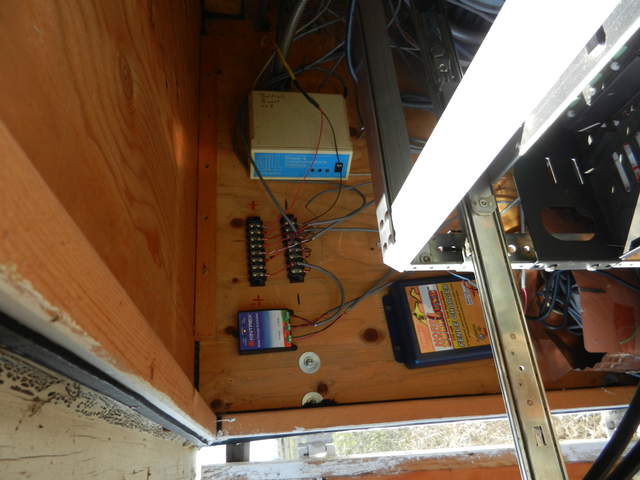
2012-02-15 I arrived about 9:00PST. It was clear, sunny, and super windy. Wind speed was about 12m/s. The field looks greener and there were some sprouting leaves on the pepper weed inside the cow fence. The cows continue to be fed directly upwind from the tower. The ditch along the road was still low in water. I drove into the field in a small car. I swapped the charge controller that was regulating the 12VDC supply. I removed a Morningstar and swapped in a Kintrex. The morning star could do 24V and I needed that at Varia. This swap brought down the power for a few minutes. I installed a LI-7700 sn TG1-0223 and NL115 sn 6761. No problems on install. After swapping the card, I changed the CR1000 program to add the LI-7700 channels. I collected data. The sensors looked clean. |
3 photos found

20120215SI_LI7700OnTower1.jpg ( 2012-02-15 11:44:33 ) Full size: 4000x3000
Eddy tower, Mt Diablo and cows

20120215SI_LI7700OnTower2.jpg ( 2012-02-15 11:45:08 ) Full size: 4000x3000
Eddy tower with Li-7700, equipment box and bridge

20120215SI_PowerCharger.jpg ( 2012-02-15 11:45:41 ) Full size: 4000x3000
Power and wiring inside the equipment box at the cow pasture
7 sets found
No data found for SI_mp.
11 SI_met graphs found
Can't check SI_mixed
2 SI_mixed graphs found
5 SI_flx graphs found
2 SI_soilco2 graphs found
Can't check TWSI_mixed
Can't check SIMBTWEE_met

