Field Notes
<--2012-01-17 12:00:00 | 2012-01-31 11:00:00-->Other sites visited today: Mayberry | Twitchell Rice | Tonzi
Phenocam link: Searching...
Sherman Island: 2012-01-25 07:30:00 (DOY 25)
Author: Joe Verfaillie
Others:
Summary: Fixed auto camera settings, cleaned radiometers, 7500.
| Sherman
2012-01-25 I arrived about 7:30. It was cool, clear and sunny with little to no wind. The field was wet with the recent rain and heavy dew. The annual grasses look a little greener than before the rain. From the bridge I could see lots of standing water on the west end of the field and the ditches were full. On the way home about 3:30pm, it looked like Walt had fed the cows directly upwind from the tower. The turned the flash off on the auto camera and pointed the camera one notch higher to avoid getting part of the tower in the frame. I cleaned dew off of the LI7500 lenses and radiation sensors. Everything else looked okay. |
2 photos found

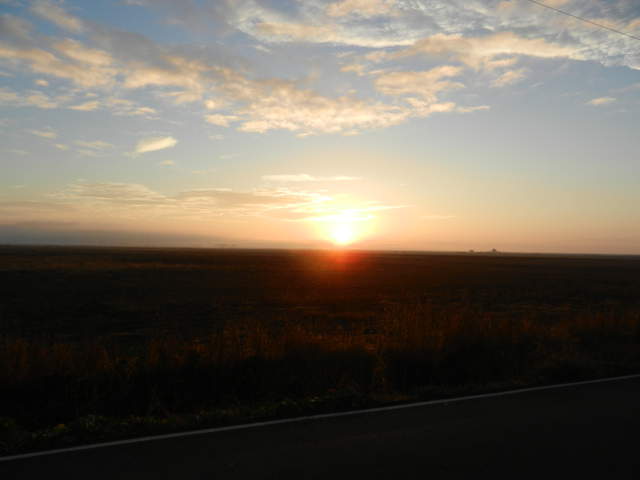
20120125SI_Dawn.jpg ( 2012-01-25 08:29:57 ) Full size: 4000x3000
Dawn

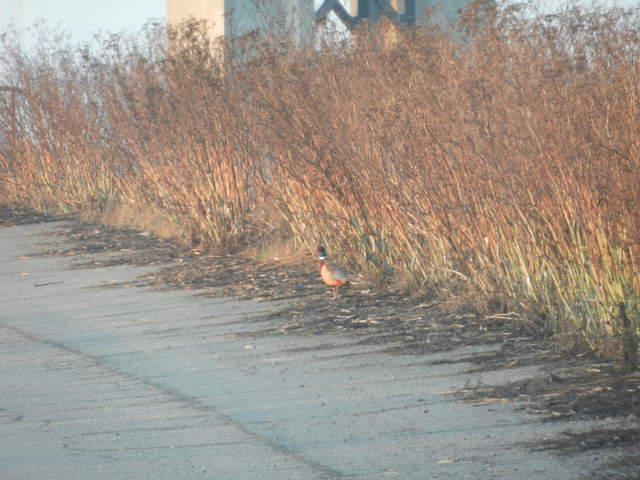
20120125SI_Pheasant.jpg ( 2012-01-25 08:34:53 ) Full size: 4000x3000
Ring necked pheasant.
7 sets found
No data found for SI_mp.
11 SI_met graphs found
Can't check SI_mixed
2 SI_mixed graphs found
5 SI_flx graphs found
2 SI_soilco2 graphs found
Can't check TWSI_mixed
Can't check SIMBTWEE_met

