
Field Notes
<--2012-01-18 09:30:00 | 2012-02-01 09:00:00-->Other sites visited today: Sherman Island | Mayberry | Twitchell Rice
Phenocam link: Searching...
Tonzi: 2012-01-25 11:30:00 (DOY 25)
Author: Joe Verfaillie
Others:
Summary: Reinstalled Tram, swapped partially installed LI820 with original LI800, serviced z-cams, floor computer hung up - restarted, check sapflow stations.
| Tonzi
2012-01-25 I arrived about 11:30PST. It was clear, sunny and warm with a nice west breeze. The ground was damp but still firm to walk on. Even the low areas were not soft. There was a puddle on the road. Tonzi?s pond did not look much fuller than before the rain. The grass looked a little happier. I set the tram up on the track and it started up soon afterwards. It seemed like a strange time to start in that it is supposed to run on the hour. Turns out the program was set to run every 5 minutes and the tram quit 5 minutes into its run down the track. I fixed the program and saw the tram complete one full run and start another before I left. I swapped the LI820 that Siyan started to install with the Li800 freshly returned from a checkup by Licor. The LI800 now has thermocouple connectors on its back side making it easier to remove. I?m not sure I got the thermocouples in the right locations on the data logger. The sample/outlet temperature should be lower than the cell/bench temperature. I set the filter to 0 seconds and turned on pressure compensation. I calibrated the LI800 with the tanks on site: N2 at 2250psi, 421.63ppm CO2 at 1800psi. 12:19PST, 942mB, 52.6C. Zero was +2.4 ppm off and span was 7.9ppm high. Things at the top of the tower looked okay. The floor computer was hung up when I got there. The data from the data loggers had a lot of repeated records in them like the computer had been starting and stopping a number of times. I didn?t look at the flux files. Probably power problems. I tried to splice the serial line to the north sap flow station where it was chewed but still could not connect to that station. There might be problems at the station itself that I did not have time to check. The serial line is two conductors (black and white) plus shield. The south sap flow station had a dead battery that I removed and brought in. The east sap flow station had a good battery but the data logger had other problems so I moved the good battery to the south station. That station seemed to be working when I left. The west sap flow station had a good battery but the data logger may have problems. I serviced the z-cams swapping cards and cleaning windows. |
Field Data
No tank data
No TZ Well data found
No TZ Moisture Point data found
No VR Moisture Point data found
No TZ grass heigth found
No VR grass heigth found
No TZ Tree DBH found
No water potential data found
No TZ Grass Biomass data found
No TZ OakLeaves Biomass data found
No TZ PineNeedles Biomass data found
4 photos found
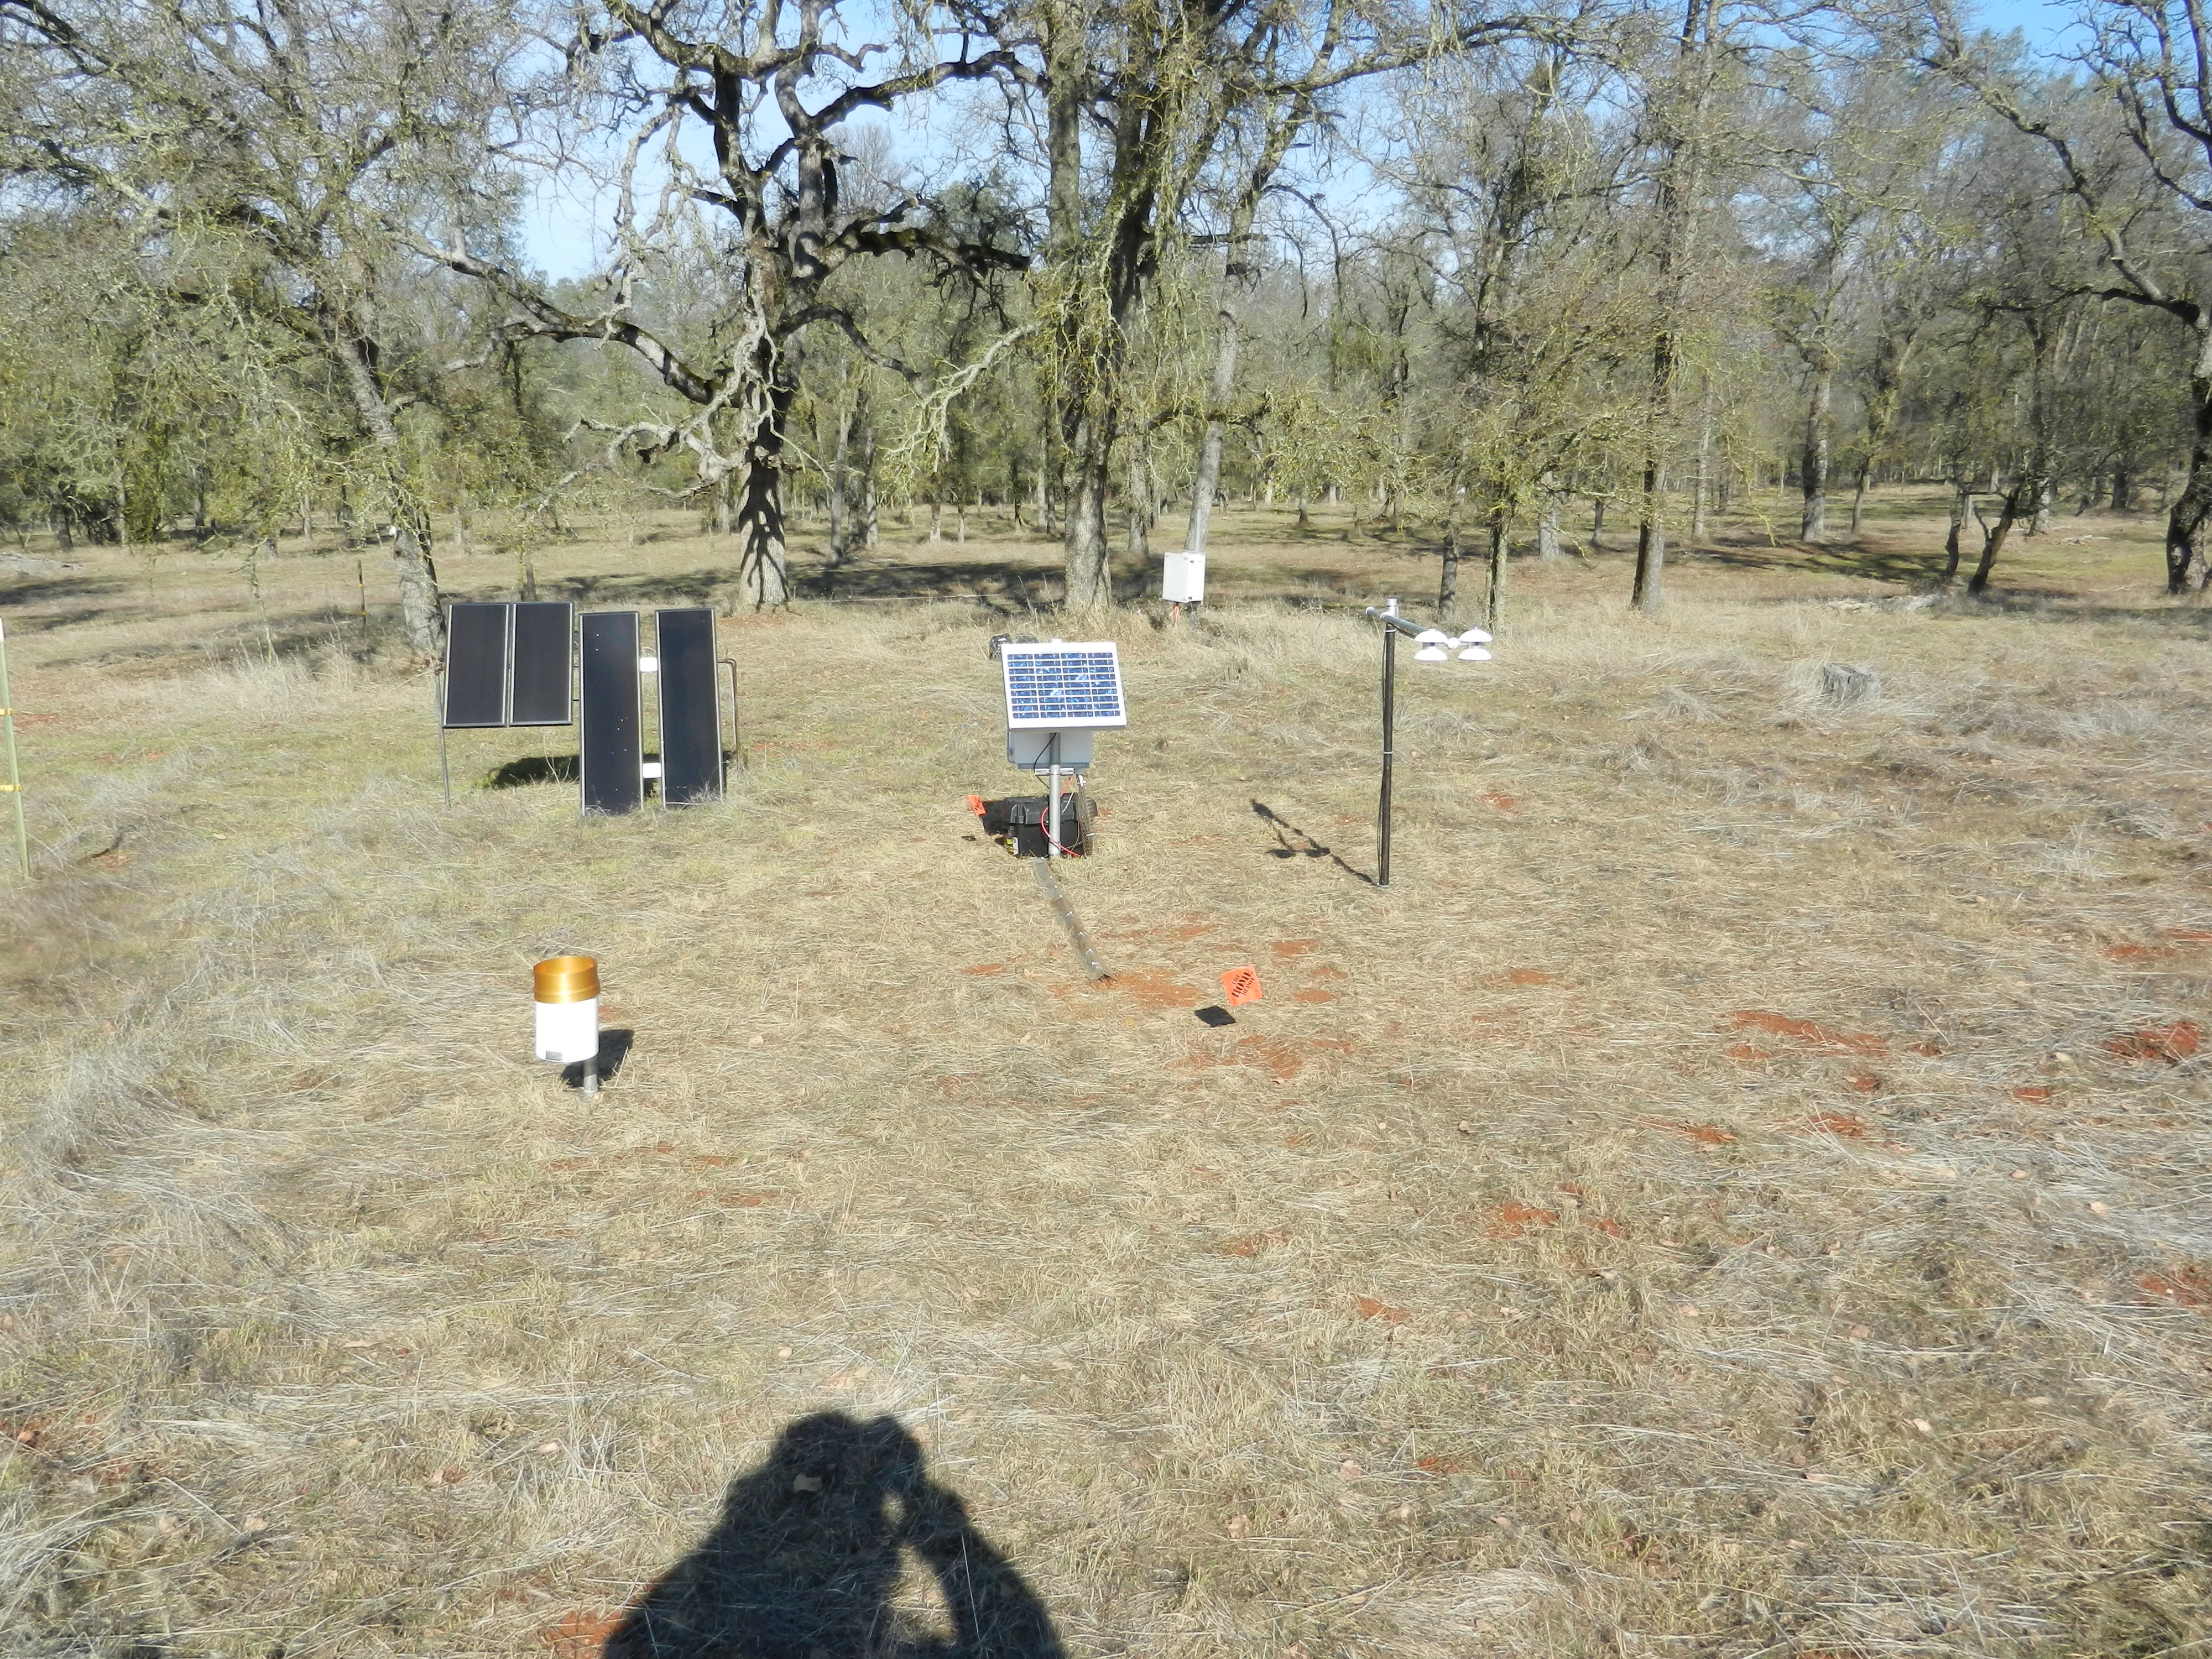
20120125TZ_OSUStation1.jpg ( 2012-01-25 14:00:16 ) Full size: 4000x3000
OSU soil moisture station 1
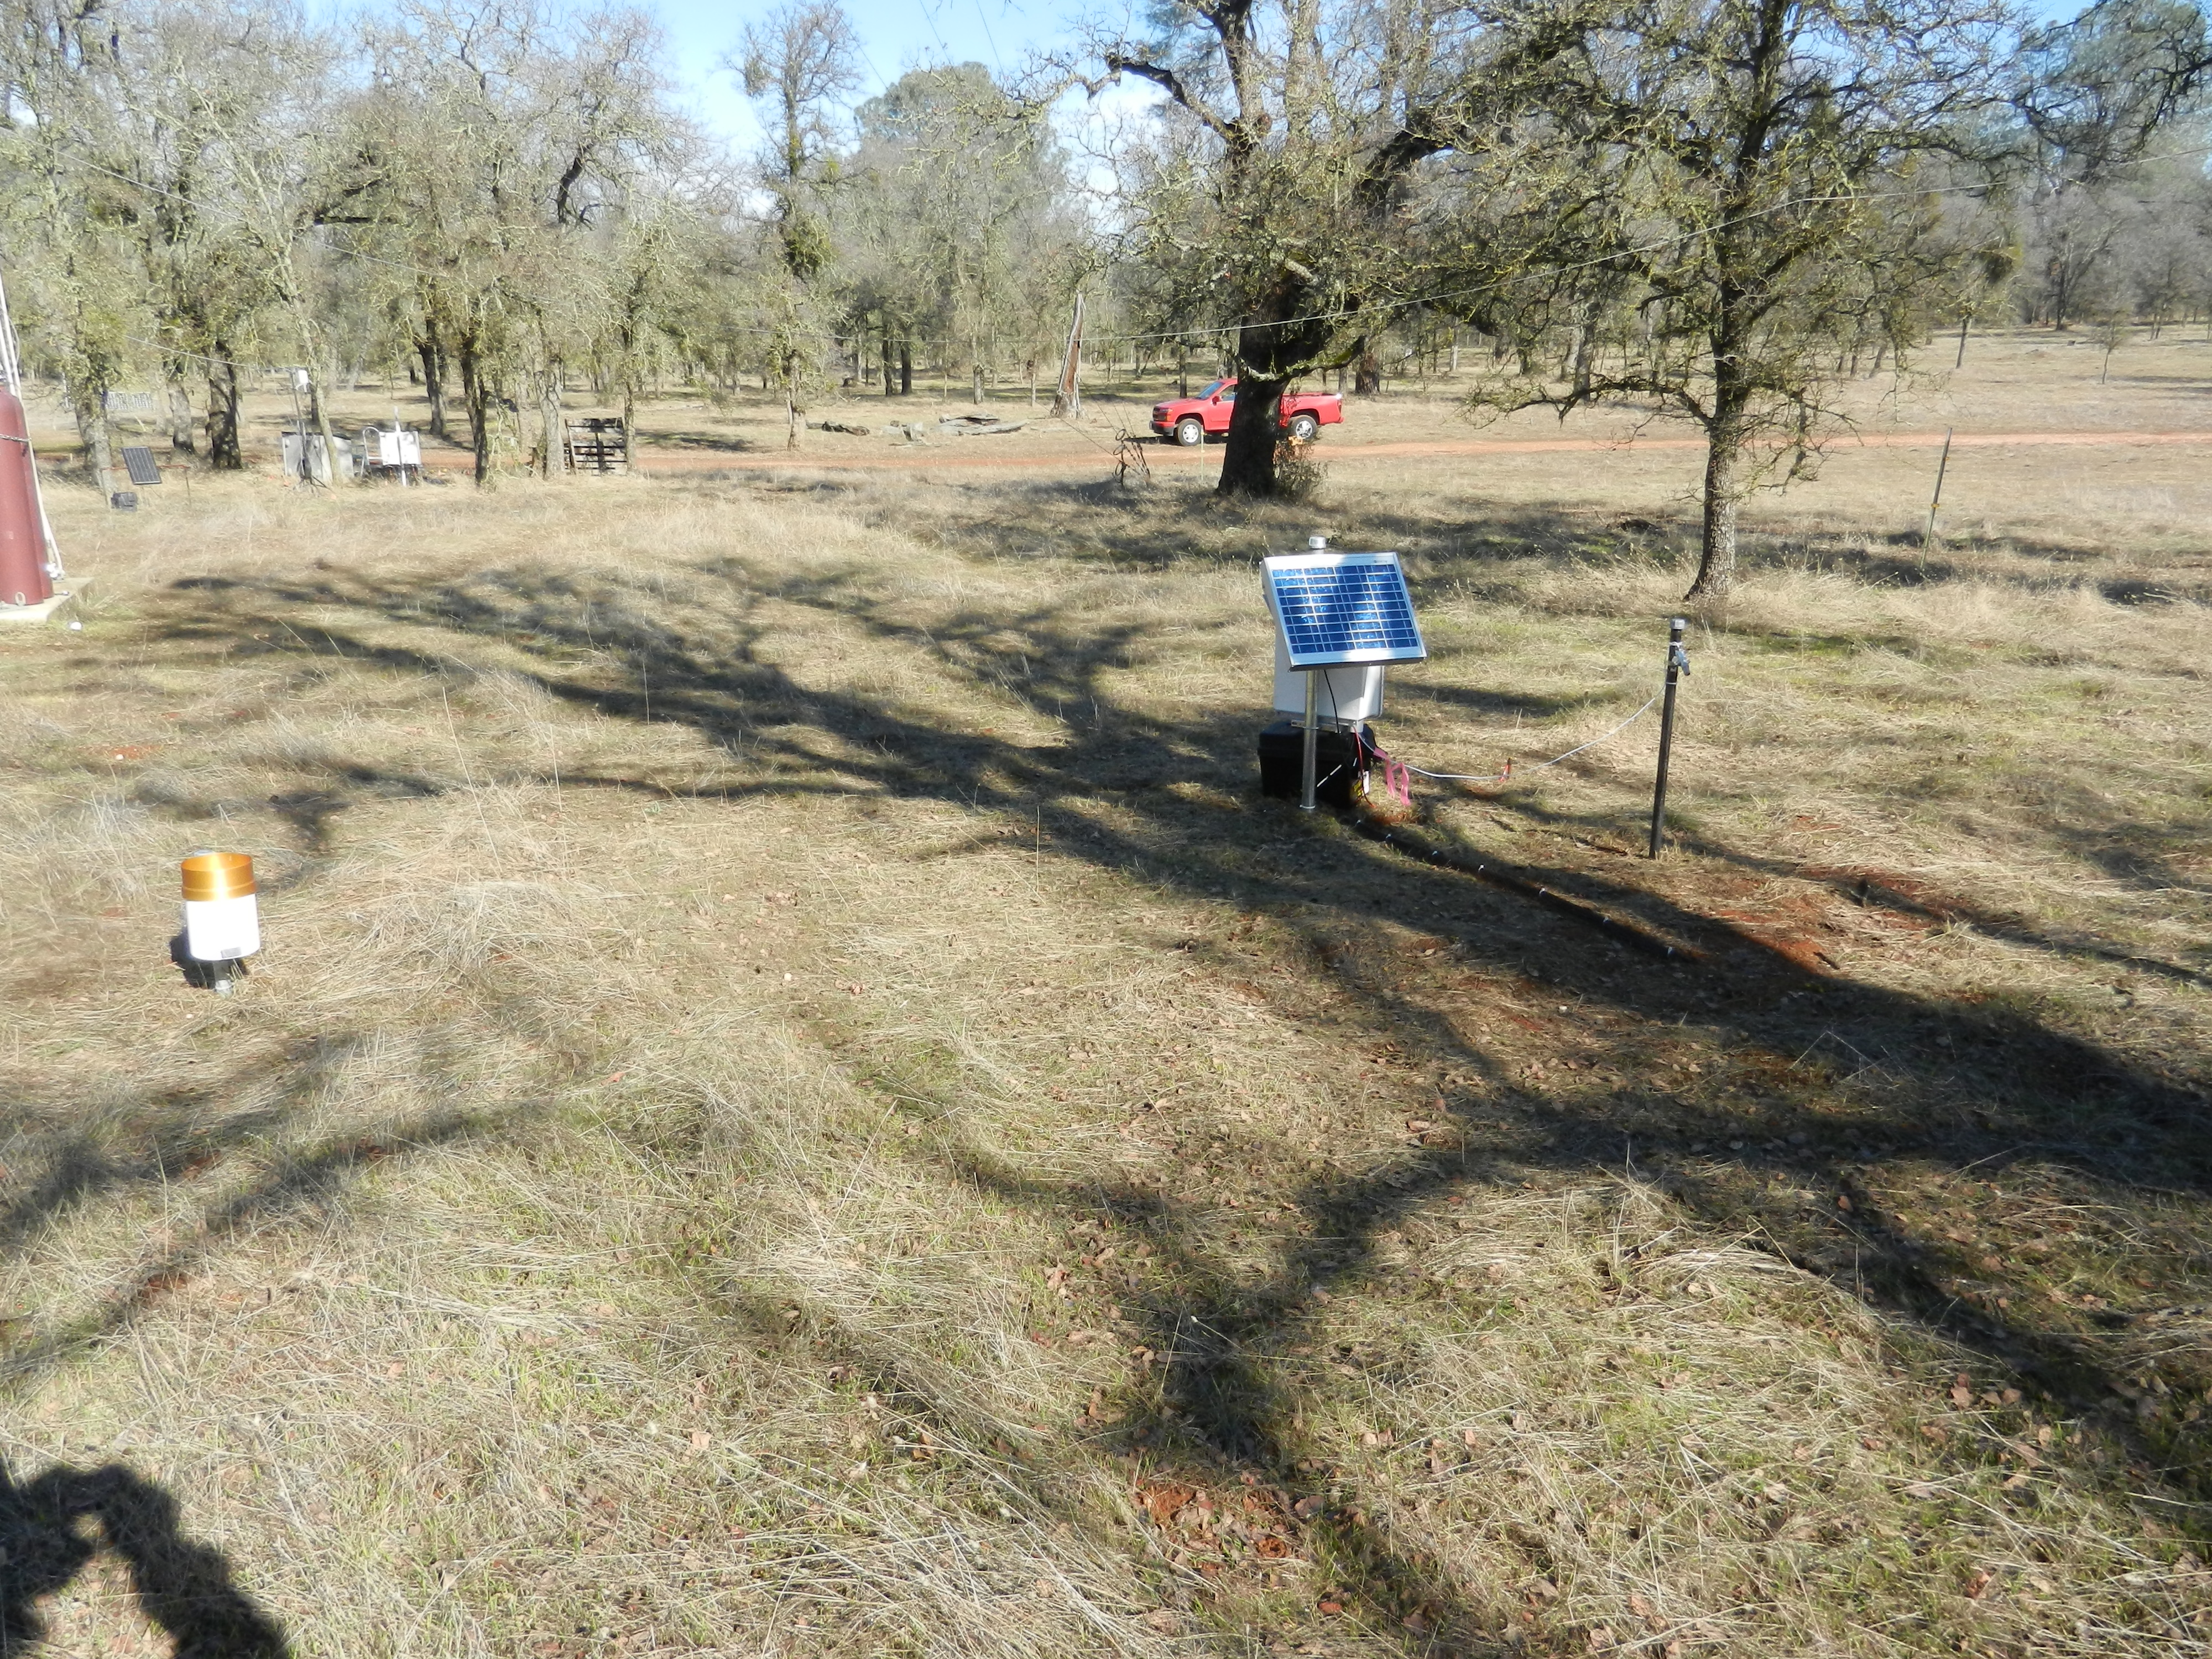
20120125TZ_OSUStation2.jpg ( 2012-01-25 13:15:41 ) Full size: 4000x3000
OSU soil moisture station 2 near tower
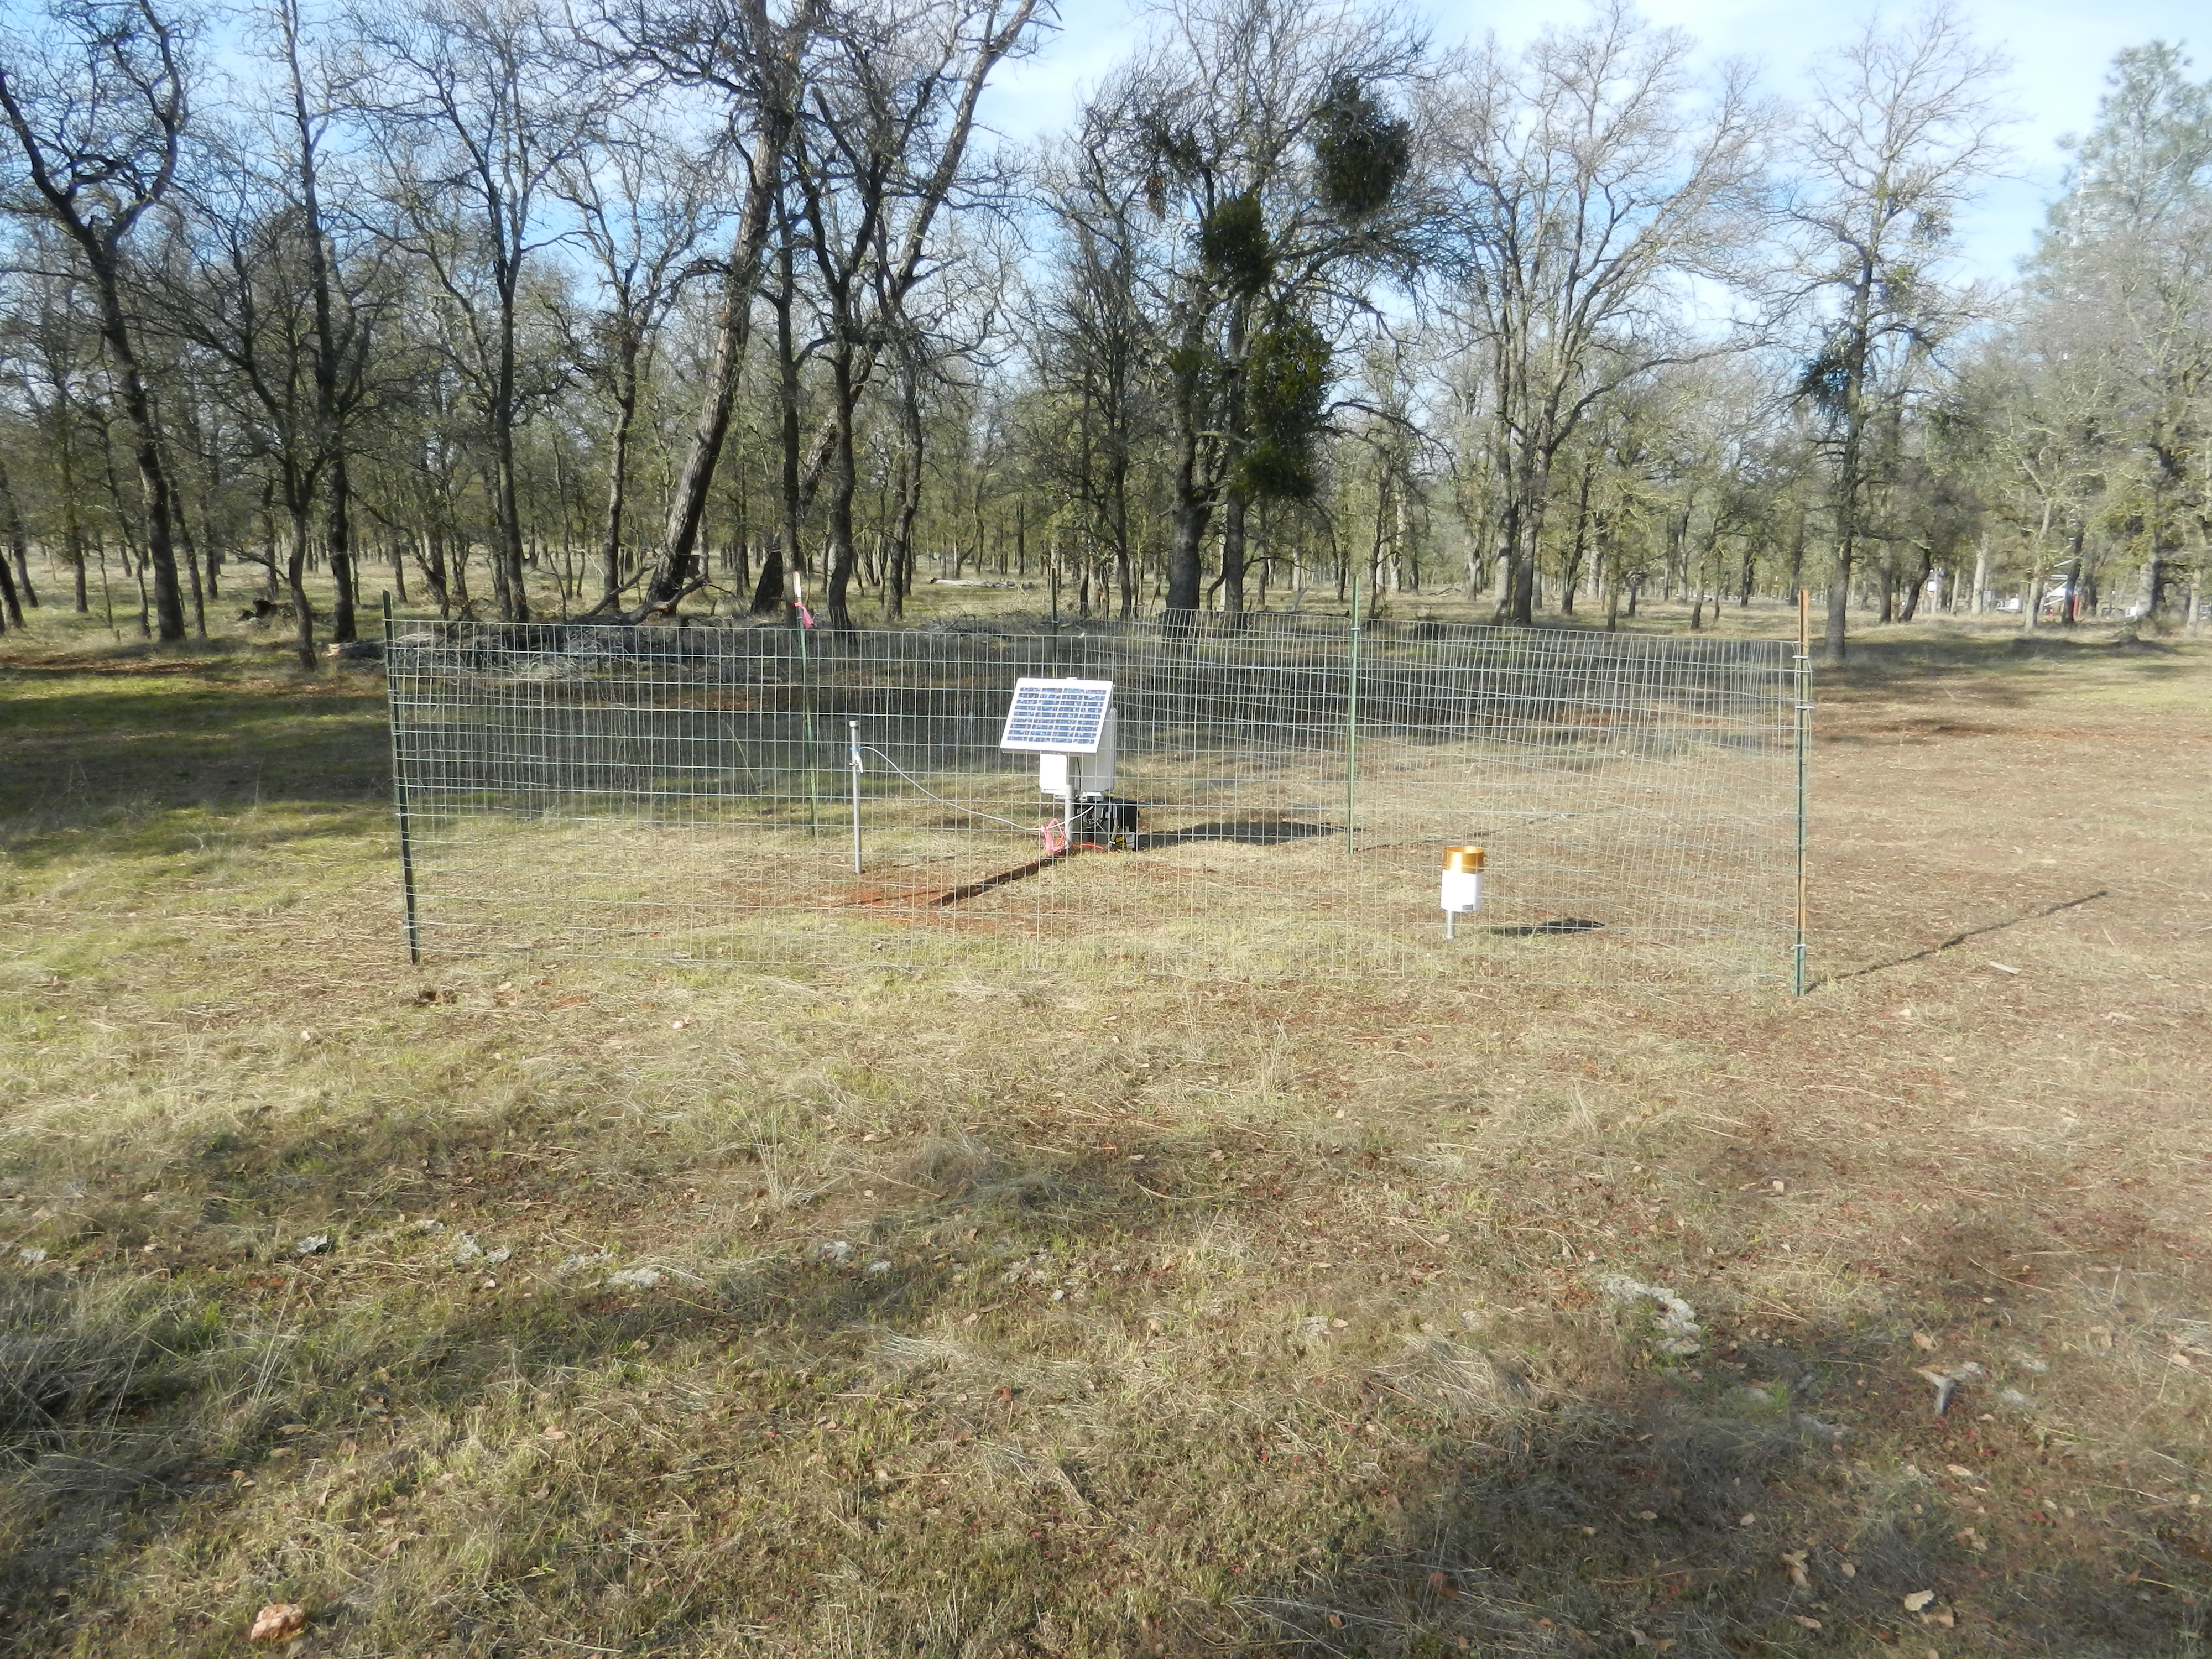
20120125TZ_OSUStation3.jpg ( 2012-01-25 15:19:14 ) Full size: 4000x3000
OSU soil moisture station 3 south east of tower.
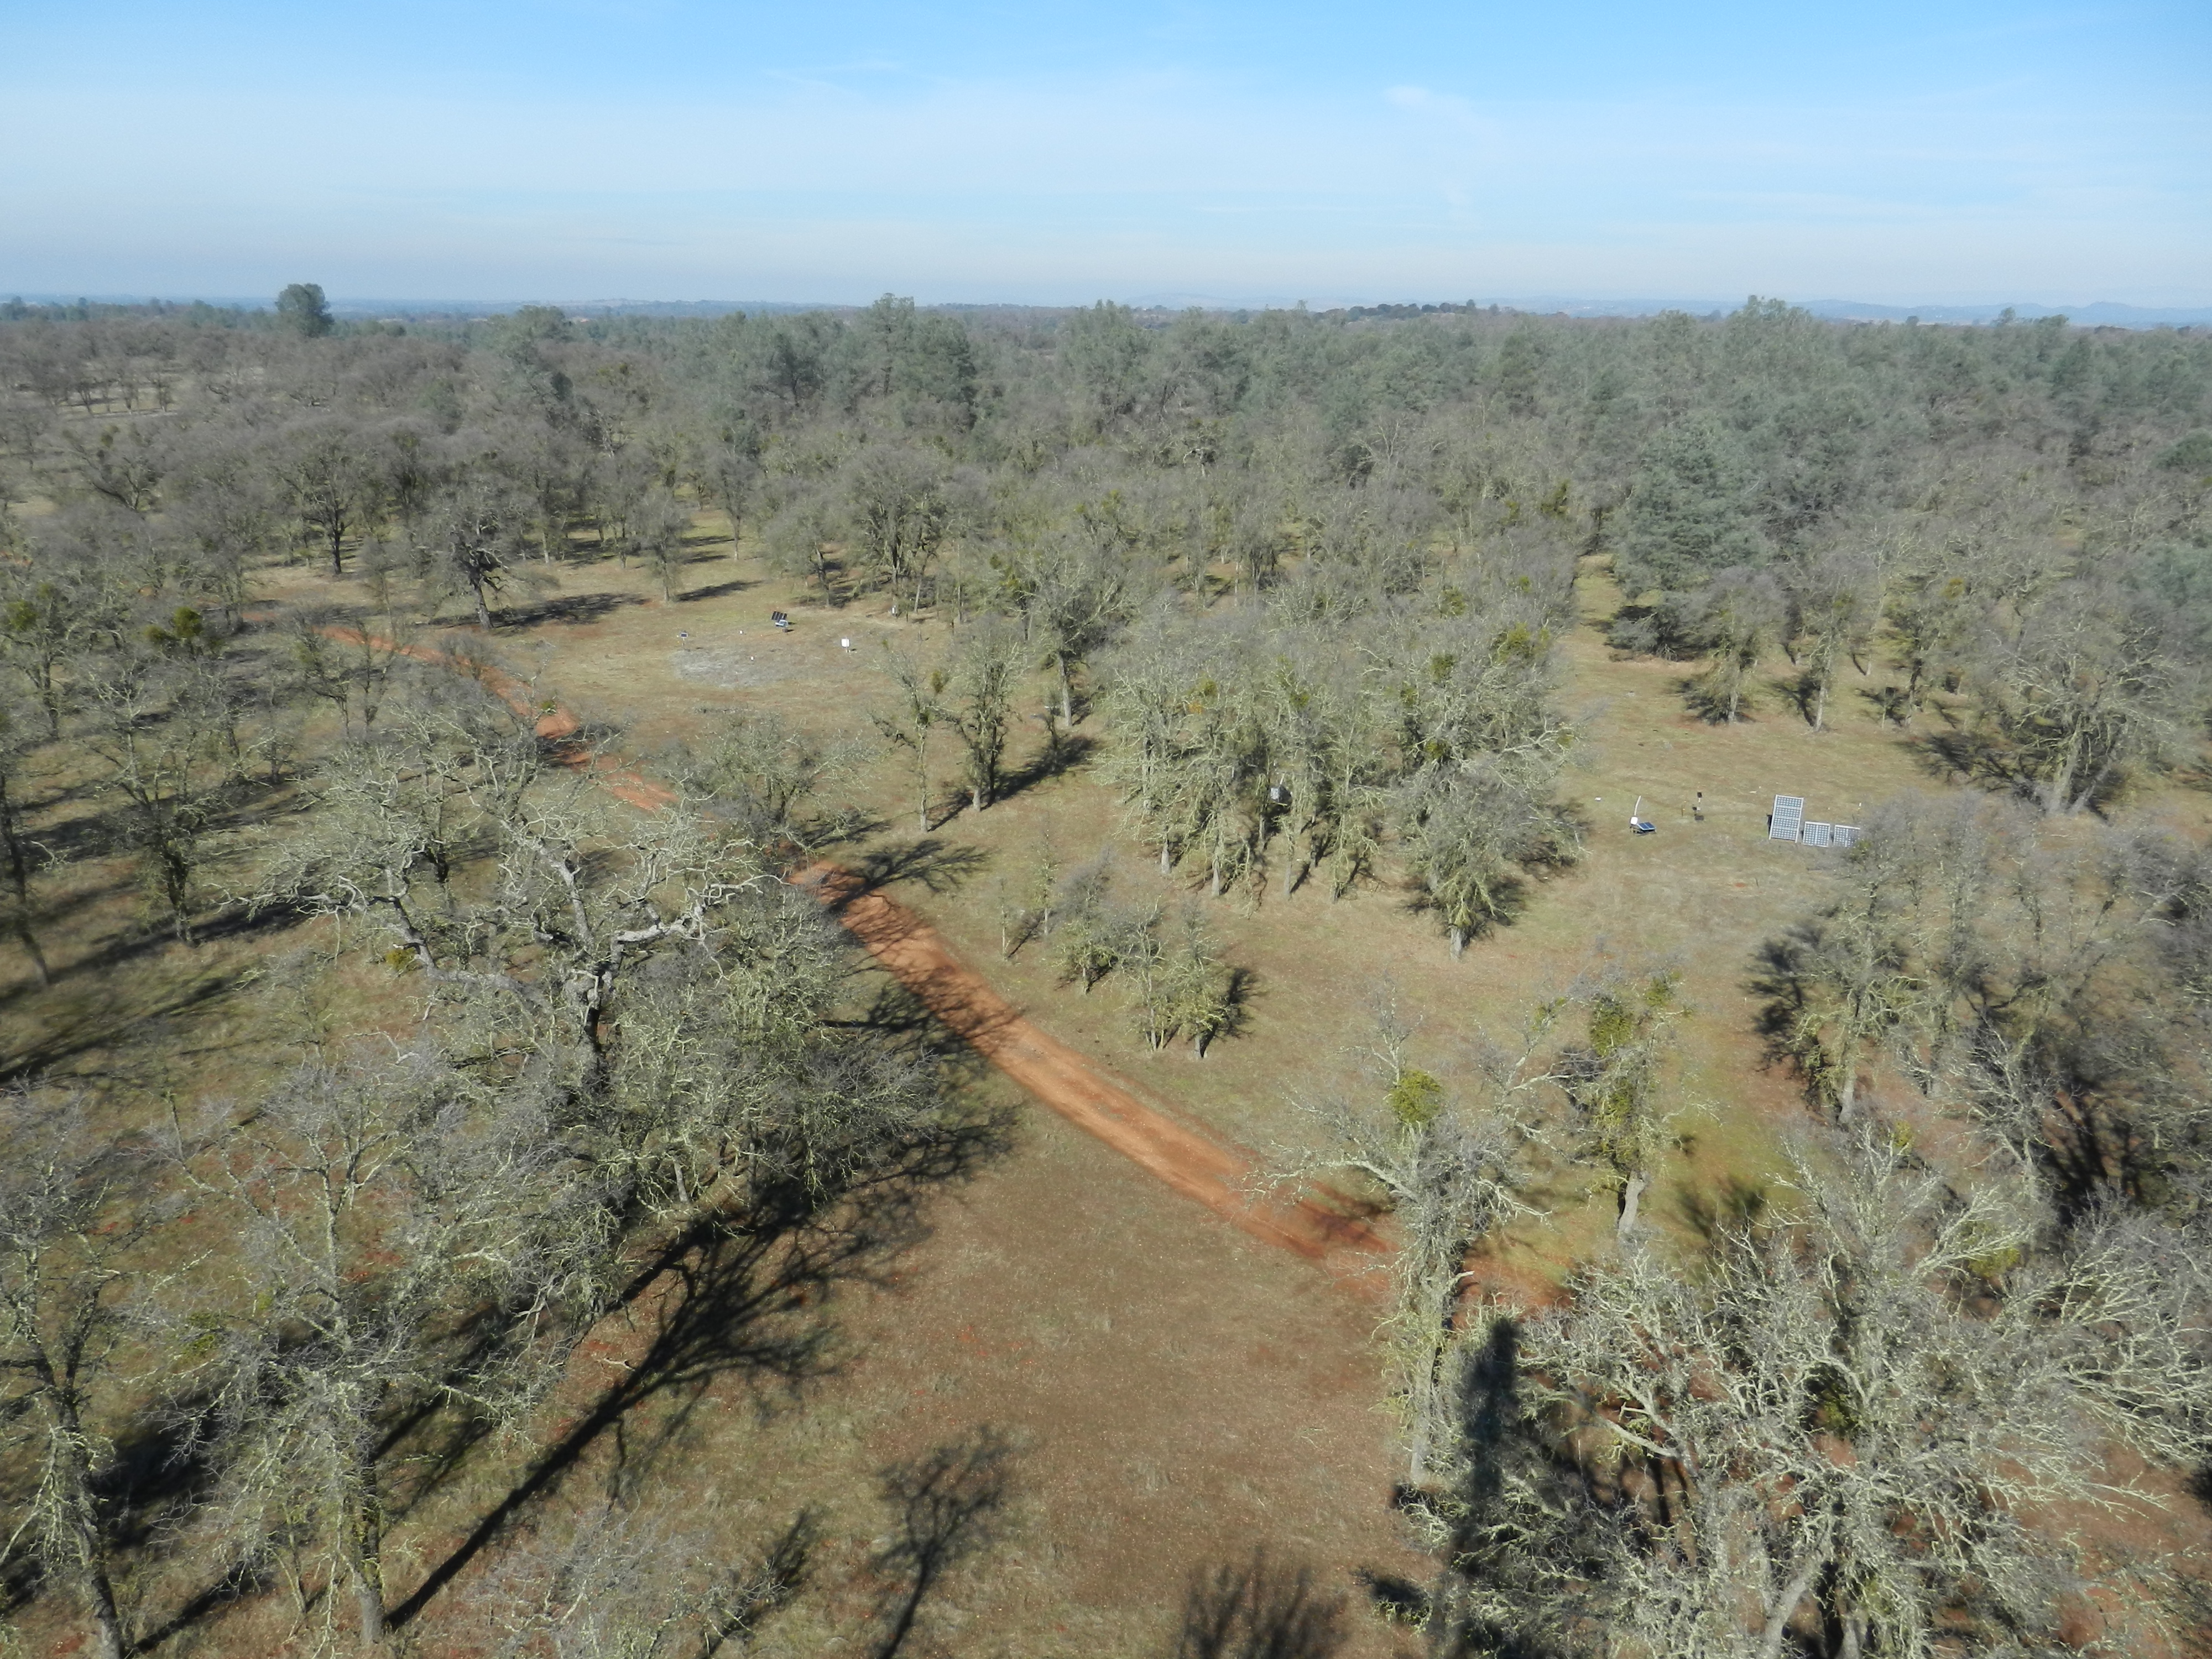
20120125TZ_SiteFRomTower.jpg ( 2012-01-25 13:11:17 ) Full size: 4000x3000
View from tower
16 sets found
No data found for TZ_Fenergy.
11 TZ_tmet graphs found
11 TZ_soilco2 graphs found
Can't check TZ_mixed
3 TZ_mixed graphs found
1 TZ_fflux graphs found
8 TZ_fmet graphs found
1 TZ_tram graphs found
3 TZ_co2prof graphs found
No data found for TZ_irt.
No data found for TZ_windprof.
1 TZ_tflux graphs found
2 TZ_sm graphs found
Can't check TZ_met
1 TZ_met graphs found
Can't check TZVR_mixed
8 TZ_osu graphs found
No data found for TZ_fd.
Tonzi Z-cam data