Field Notes
<--2011-11-09 09:20:00 | 2011-12-01 09:00:00-->Other sites visited today: Sherman Island | Twitchell Rice | Vaira
Phenocam link: Searching...
Tonzi: 2011-11-16 12:00:00 (DOY 320)
Author: Joe Verfaillie
Others:
Summary: Fixed Stardot ethernet, removed N2 scrub and recaled LI810, Changed cr10x2_soiltemp program, fixed two STC and removed SHF5, serviced z-cams.
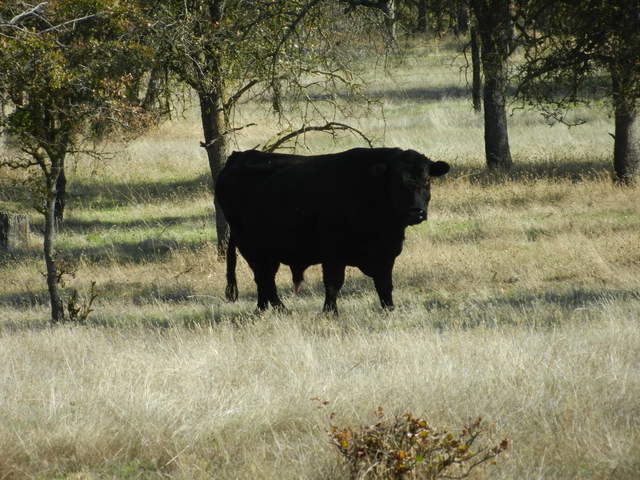
| Tonzi 2011-11-16 I arrived about 12 noon PST. It was clear, sunny and warm with little to no wind. There were a couple of big black bulls munching grass near the site. The grass here looks a little stressed and the ground seems dry. The trees are in mid leaf loss. The Ethernet cable for the Stardot camera was loose. I secured it to a neighboring serial plug with a cable tie. I probably need to cut a notch in the computer case to allow the cable to latch better. I removed the scrub on the N2 tank. I had to borrow a fitting from downstream side of the profile pump. The fitting just dampened the noise from the pump and I use some tape to replace it. After removing the scrub I recalibrated the LI810: 1:03PST, 939mBar, 52.6C, Heat ON, filter 0sec, range 1000ppm, bench 5.5in alarms Disabled, 11.9V Running N2 (1100psi) the LI810 read -5.5pppm. This almost the same offset the Siyan saw last time but opposite sign. Running CO2 384.08ppm (450psi) the LI810 read 384.0 Looks like the scrub was adding about 5.5ppm CO2 to the zero. I serviced the z-cams swapping cards and cleaning windows. I updated the program on CR10x2 the soil temperature logger. The original program was using the wrong range for the SHF plates. The original program used a 2500mV range when it should have been a 7.5mV range. This led to poor resolution in the SHF signals. I fixed this and added year to the data output. The new header is below. I downloaded all the data before uploading the program. I noticed that two soil temp were not reporting (STCB1 and STCB5). Also SHF5 was not working and was the reason for discovering the problem with the program. All three of these had loose wires on the AM25T. Reseating the wires on the TCs fixed them but not the SHF plate. I traced that wire and found that it had been cut by a gopher. I brought the SHF plate sn 000144 in for repair. The cable insulation shows cracking too. Tonzi CR10X2 ? soil temperature 1 100 L 2 Year_RTM L 3 Day_RTM L 4 Hour_Minute_RTM L 5 Mux_Temp_AVG L 6 Batt_Volt_AVG L 7 STCA_1_AVG L 8 STCA_2_AVG L 9 STCA_3_AVG L 10 STCA_4_AVG L 11 STCA_5_AVG L 12 STCB_1_AVG L 13 STCB_2_AVG L 14 STCB_3_AVG L 15 STCB_4_AVG L 16 STCB_5_AVG L 17 STCC_1_AVG L 18 STCC_2_AVG L 19 STCC_3_AVG L 20 STCC_4_AVG L 21 STCC_5_AVG L 22 STCD_1_AVG L 23 STCD_2_AVG L 24 STCD_3_AVG L 25 STCD_4_AVG L 26 STCD_5_AVG L 27 SM_1_AVG L 28 SM_2_AVG L 29 SM_3_AVG L 30 SM_4_AVG L 31 SM_5_AVG L 32 Pressure_AVG L 33 Air_Temp_AVG L 34 RH_AVG L |
Field Data
No tank data
No TZ Well data found
No TZ Moisture Point data found
No VR Moisture Point data found
No TZ grass heigth found
No VR grass heigth found
No TZ Tree DBH found
No water potential data found
No TZ Grass Biomass data found
No TZ OakLeaves Biomass data found
No TZ PineNeedles Biomass data found
1 photos found

20111116TZ_Cow.jpg ( 2011-11-16 13:18:46 ) Full size: 4000x3000
Big black cow at Tonzi
16 sets found
No data found for TZ_Fenergy.
11 TZ_tmet graphs found
11 TZ_soilco2 graphs found
Can't check TZ_mixed
3 TZ_mixed graphs found
1 TZ_fflux graphs found
8 TZ_fmet graphs found
1 TZ_tram graphs found
3 TZ_co2prof graphs found
No data found for TZ_irt.
No data found for TZ_windprof.
1 TZ_tflux graphs found
2 TZ_sm graphs found
Can't check TZ_met
1 TZ_met graphs found
Can't check TZVR_mixed
No data found for TZ_osu.
No data found for TZ_fd.
Tonzi Z-cam data

