
Field Notes
<--2011-11-16 12:00:00 | 2011-12-01 10:00:00-->Other sites visited today: Twitchell Rice | Tonzi | Vaira
Phenocam link: Searching...
Tonzi: 2011-12-01 09:00:00 (DOY 335)
Author: Siyan Ma
Others: Joe, Laurie, Erika
Summary: Standard field work. Laurie and Erika tried soil cores and tree cores.
|
Pond When: Date: 12/1/2011 , Day: 335 , Watch Time: 9:00 am . Where: Tonzi/Vaira Ranch Who: Siyan, Joe, Laurie, and Erica Weather: windy Phenology: green grass, oak leaves totally fell at Tonzi.
Summary
Vaira_Grass Site


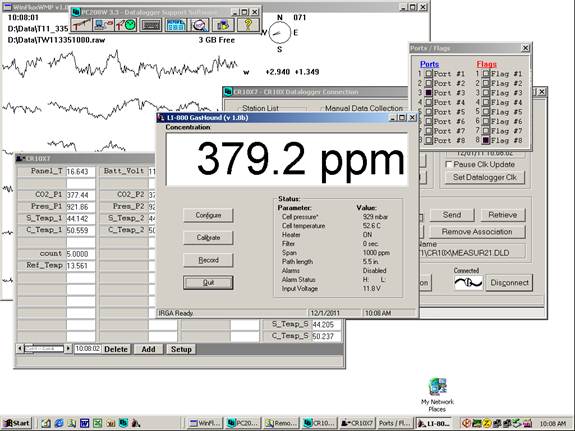
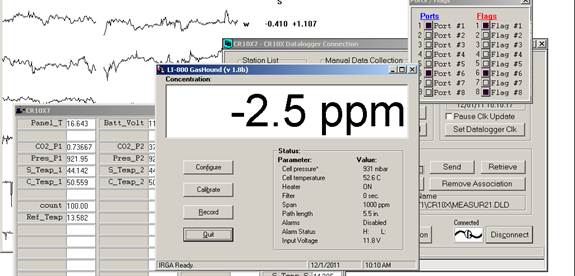
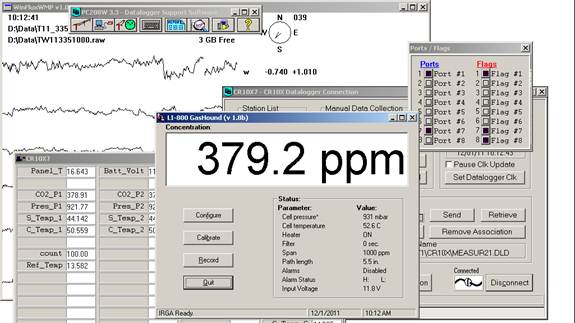
Tonzi_Tower Site

CO2 300 psig; flow 20 psi; 384.08 ppm. N2 1000 psig; flow 20 psi. Manually calibrate Li-800. Following Ted’s instruction: H:\IoneSavanna_2004\Tower_2004\CO2Profile\LI800_Calibration_Procedure_2Nov04.txt Is the pump running YES! 
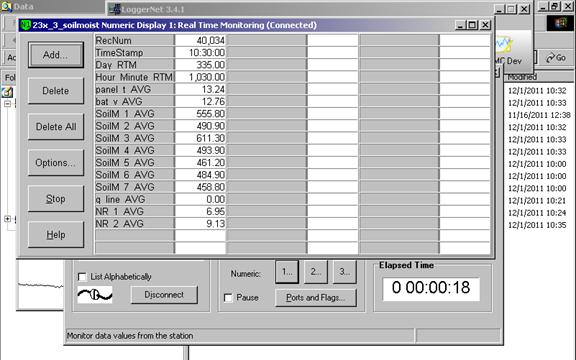
Toniz_Floor Site

CR23X3 – floor-Met CR23X5 – soil CO2 profile CR23X6 – tower-Met CR10X2 – floor-Met 
Reading from datalogger Reading from panels of analyzers
Notes: “X” means not working any more. Dendrometers installed by Gretchen group  | ||||||||||||||||||||||||||||||||||||||||||||||||||||||||||||||||||||||||||||||||||||||||||||||||||||||||||||||||||||||||||||||||||||||||||||||||||||||||||||||||||||||||||||||||||||||||||||||||||||||||||||||||||||||||||||||||||||||||||||||||||||||||||||||||||||||||||||||||||||||||||||||||||||||||||||||||||||||||||||||||||||||||||||||||||||||||||||||||||||||||||||||||||||||||||||||||||||


Field Data
No tank data
No TZ Well data found
No TZ Moisture Point data found
No VR Moisture Point data found
No TZ grass heigth found
No VR grass heigth found
No TZ Tree DBH found
Water Potential - mode: raw
| Time | Species | Tree | readings (bar) | ||
|---|---|---|---|---|---|
| 2011-12-01 11:48:00 | OAK | UNKNOWN | -11.5 | -16 | -16 |
| 2011-12-01 11:48:00 | PINE | OLD | -21 | -21 | -6.5 |
| 2011-12-01 11:48:00 | PINE | YNG | -4 | -3.5 | -10 |
No TZ Grass Biomass data found
No TZ OakLeaves Biomass data found
No TZ PineNeedles Biomass data found
6 photos found
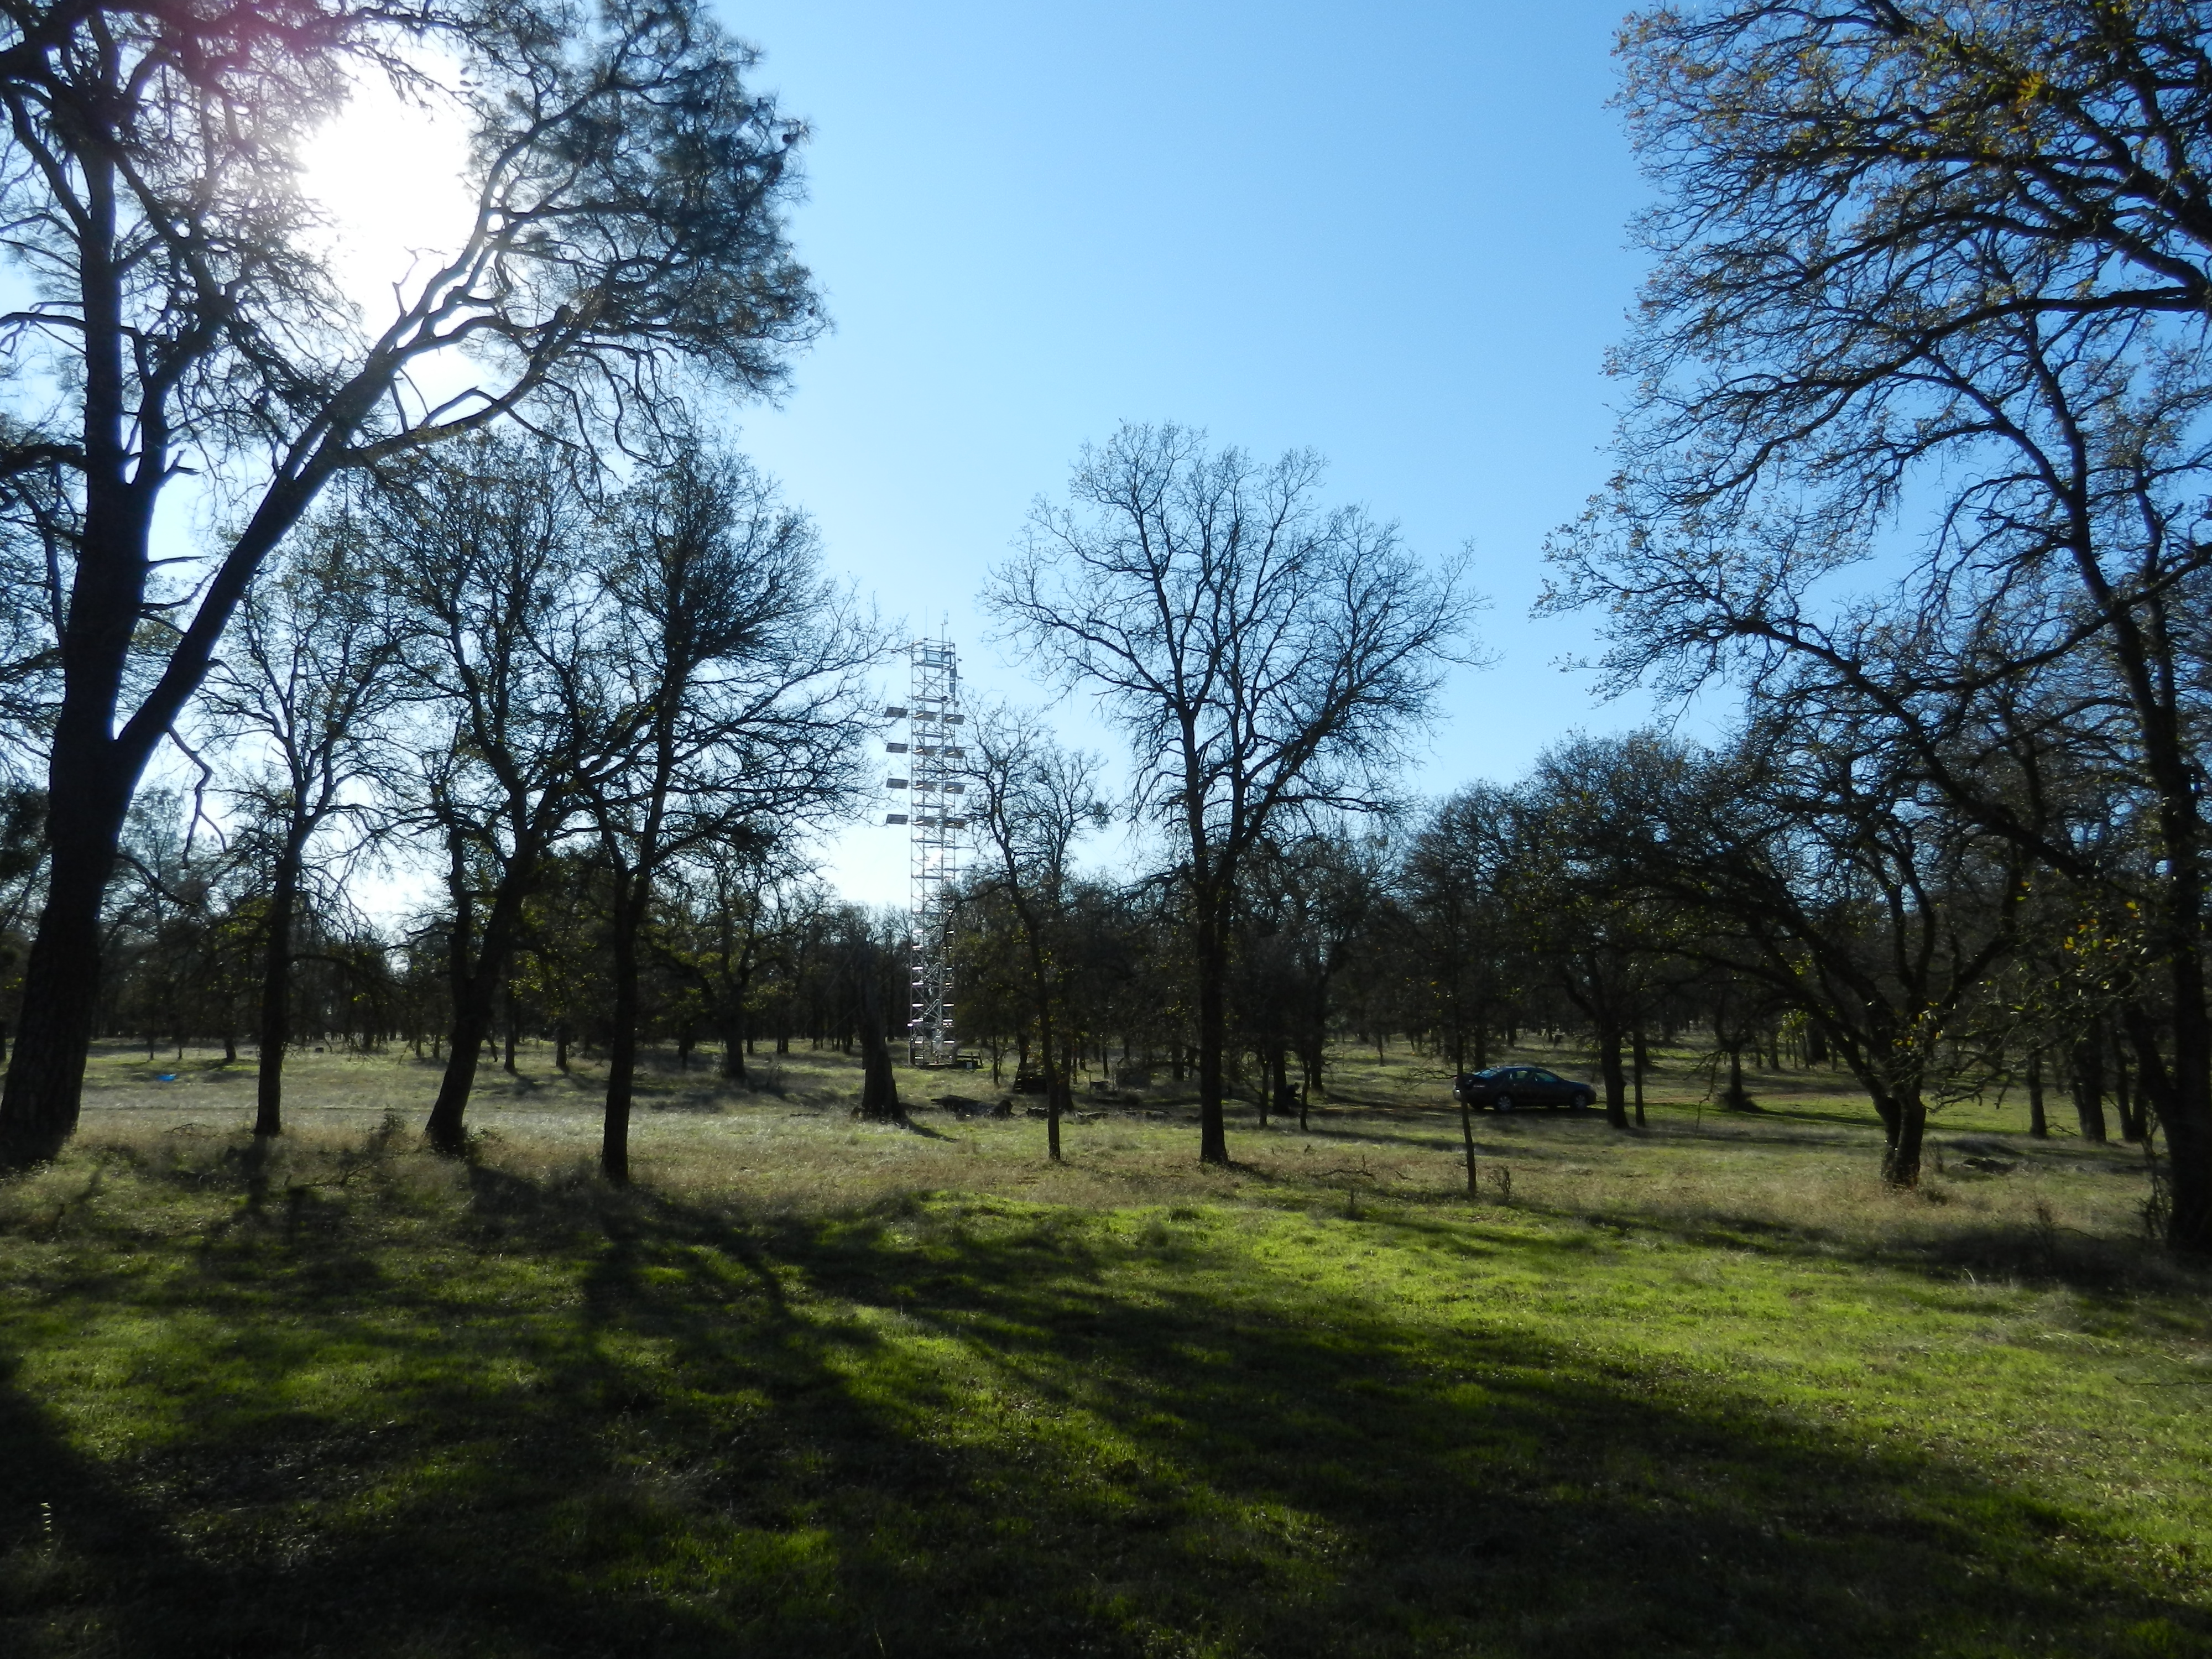
20111201TZ_Tower.jpg ( 2011-12-01 14:21:27 ) Full size: 4000x3000
Green grass at Tonzi with the tower in the background
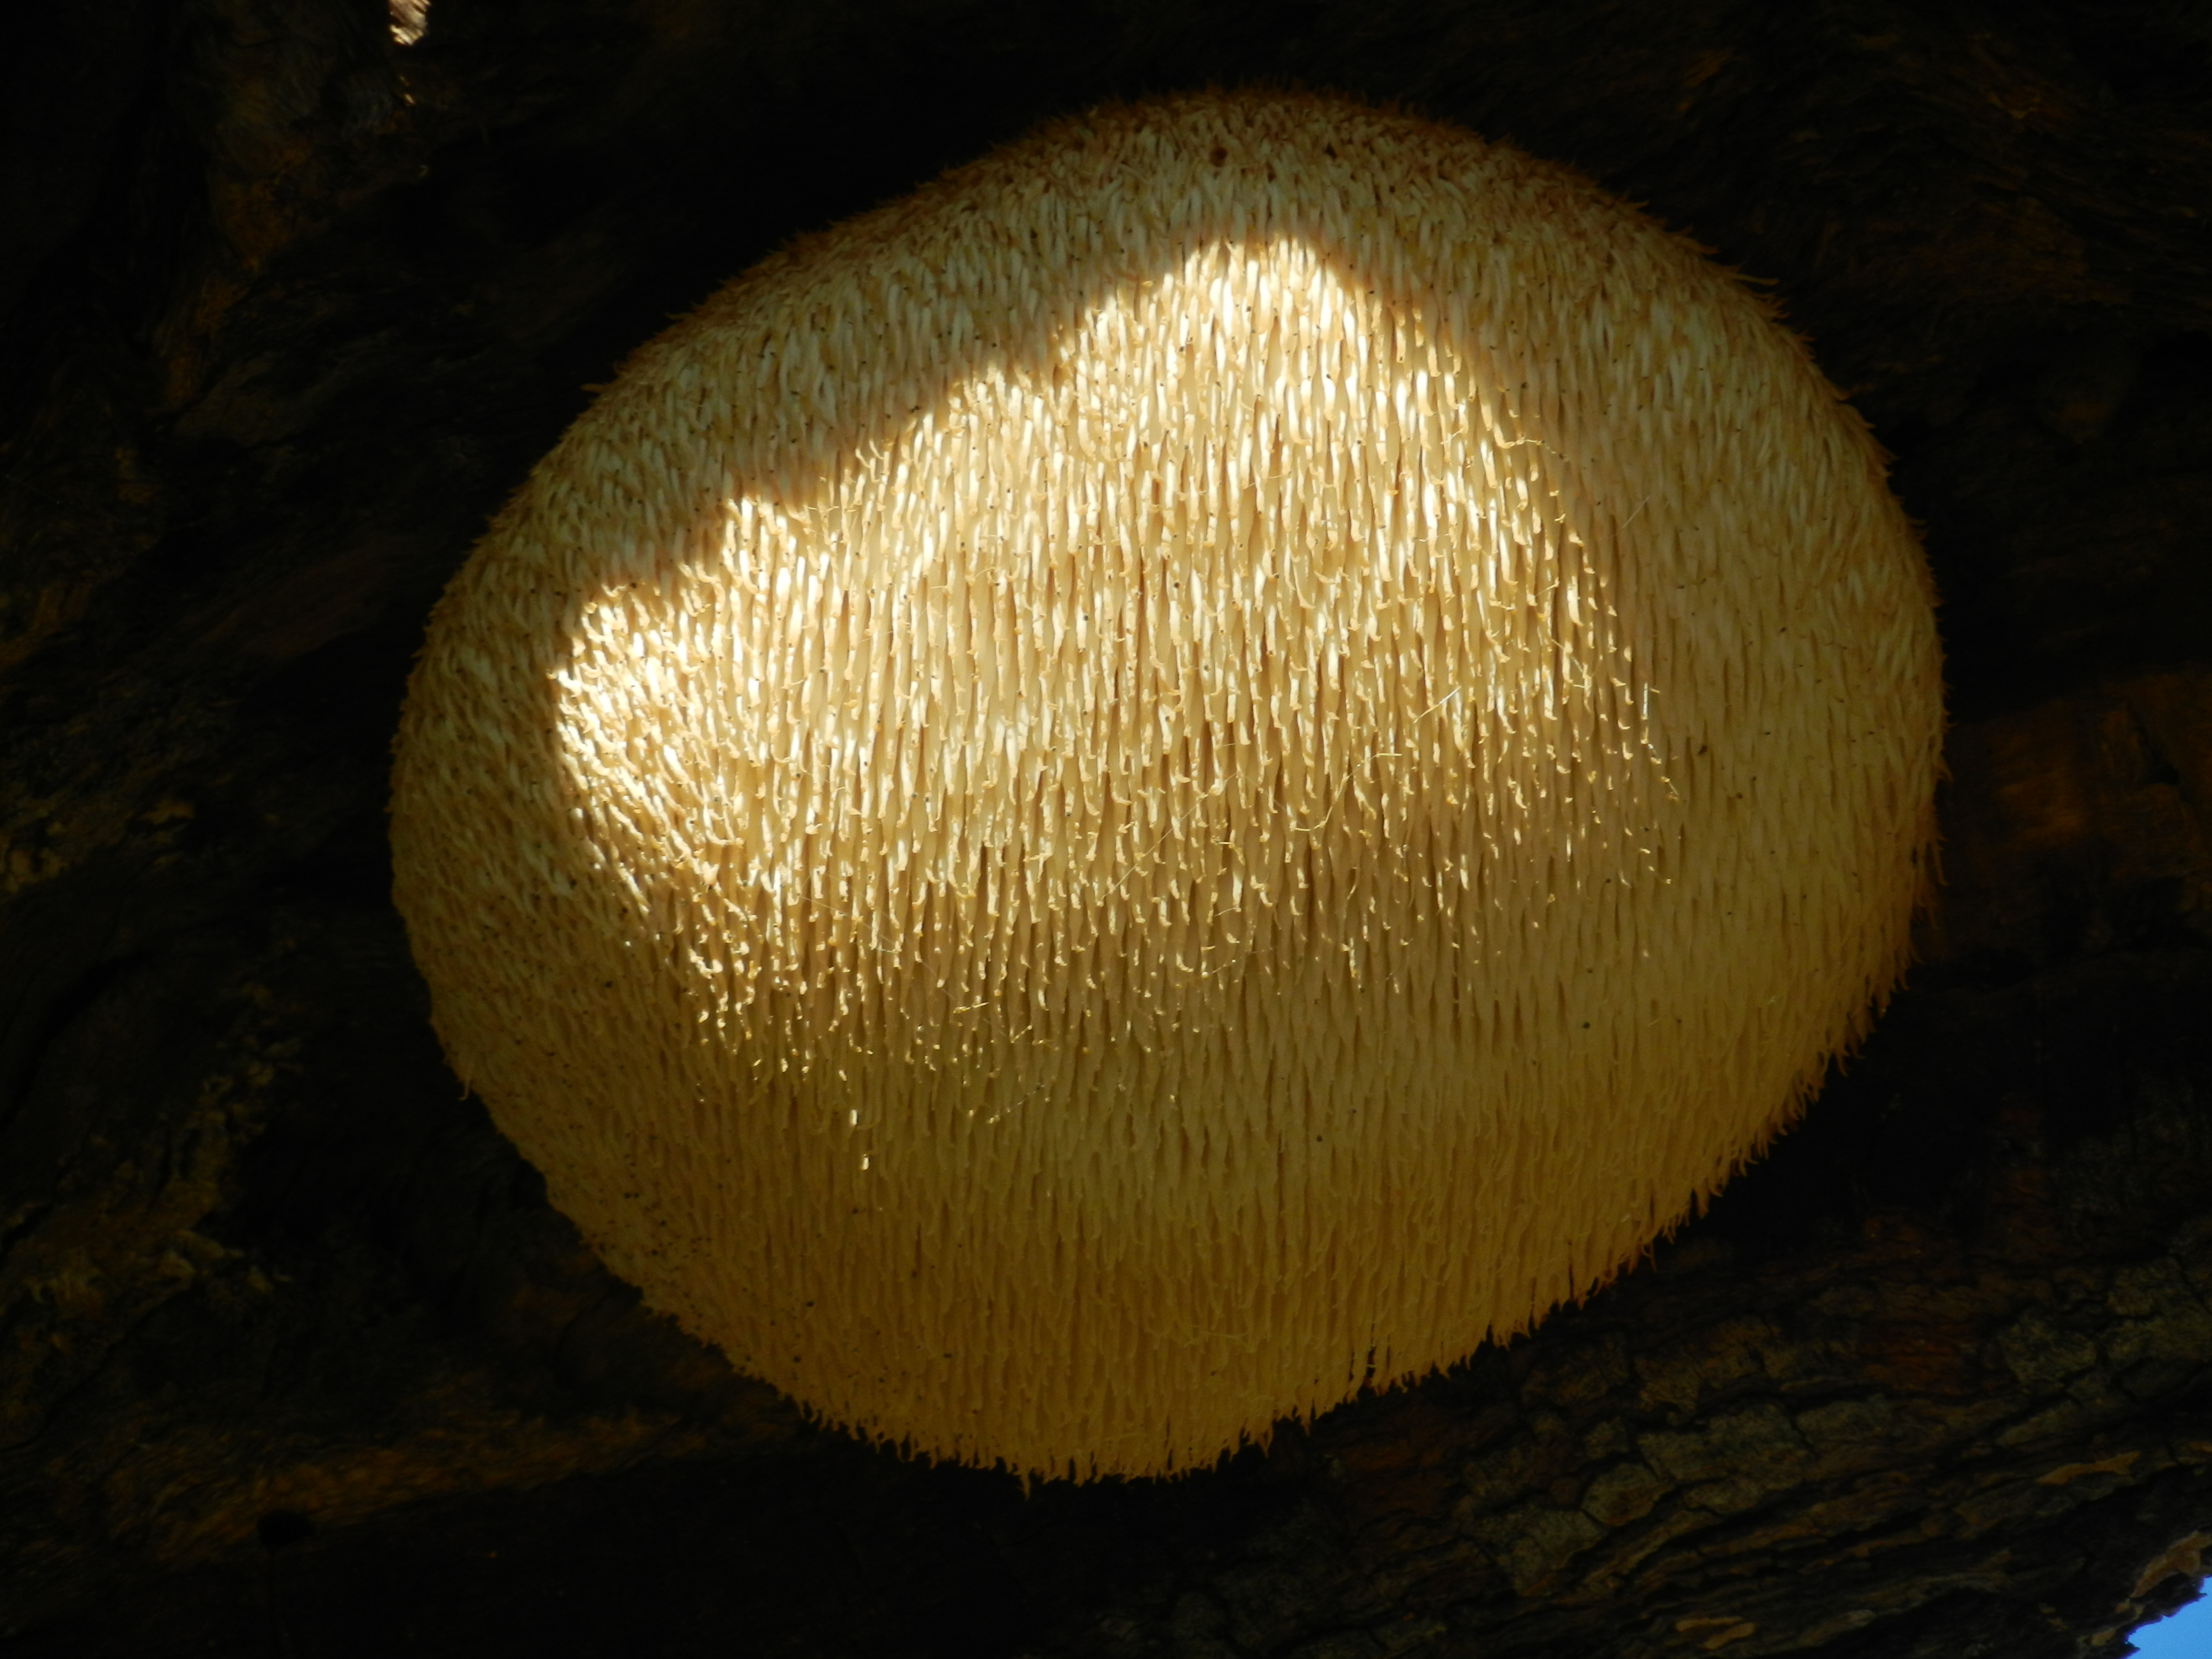
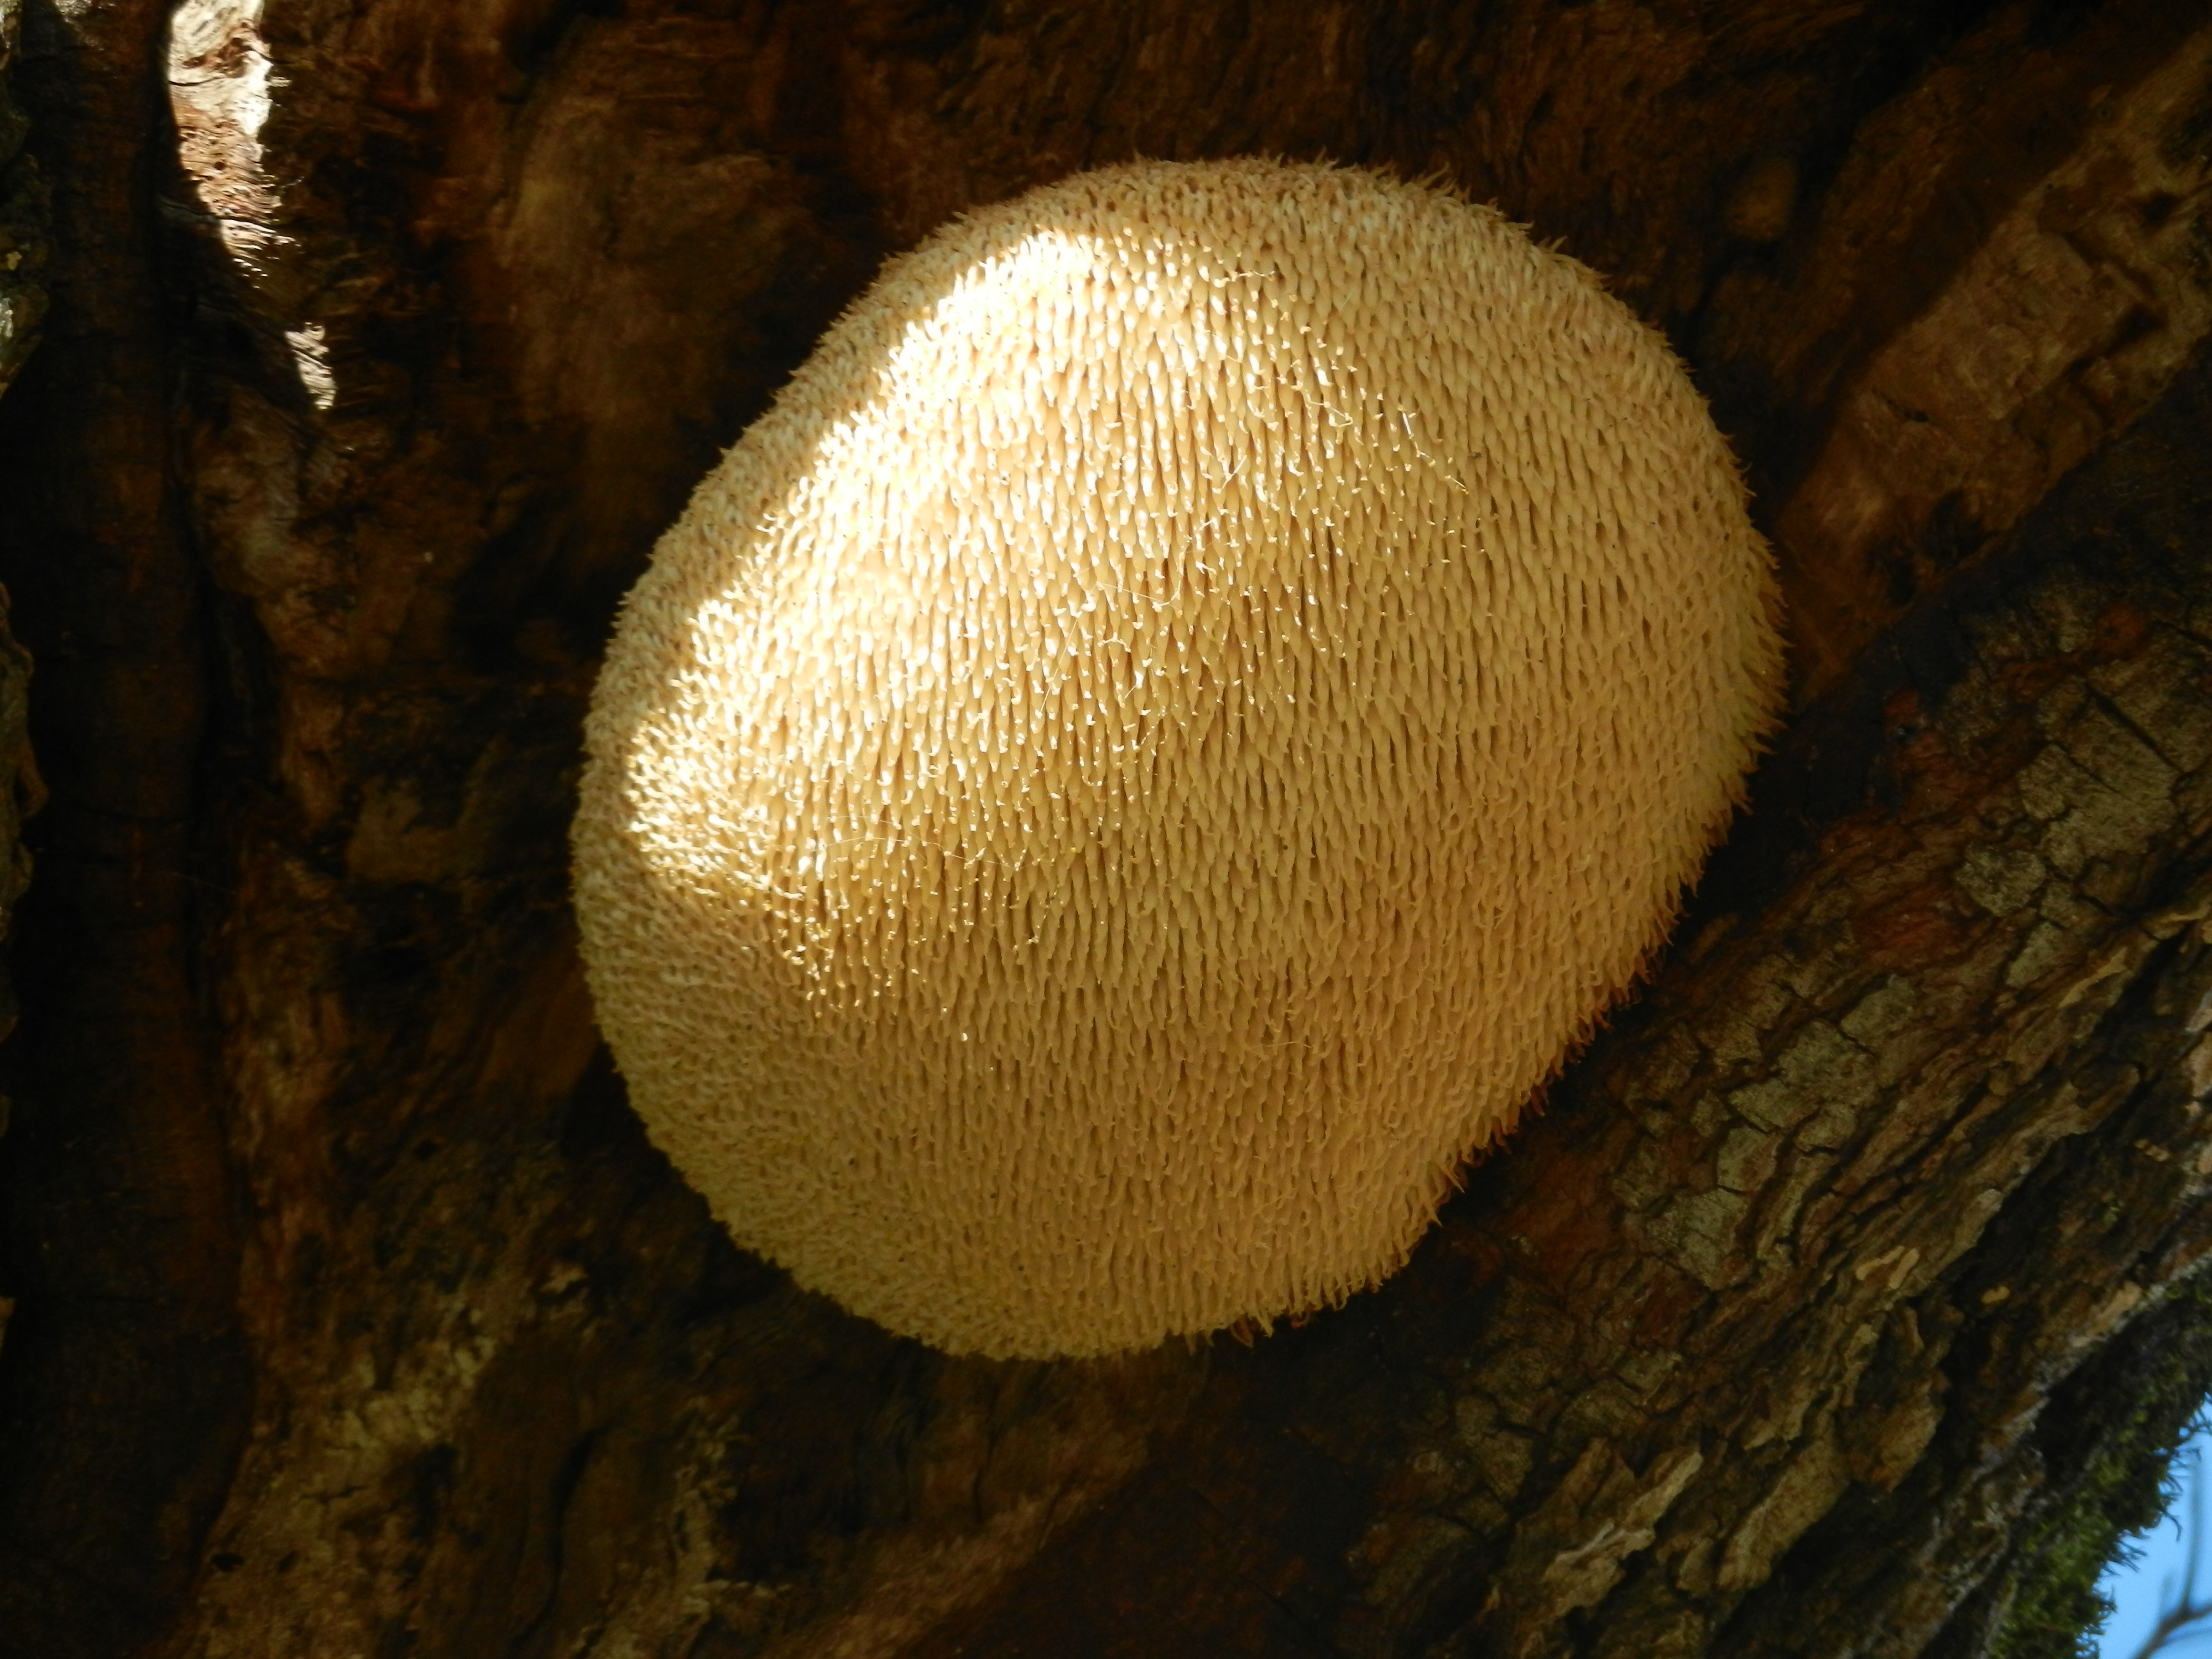
20111201TZ_TreeFungus1.jpg ( 2011-12-01 14:15:42 ) Full size: 4000x3000
Lion's mane fungus on oak tree
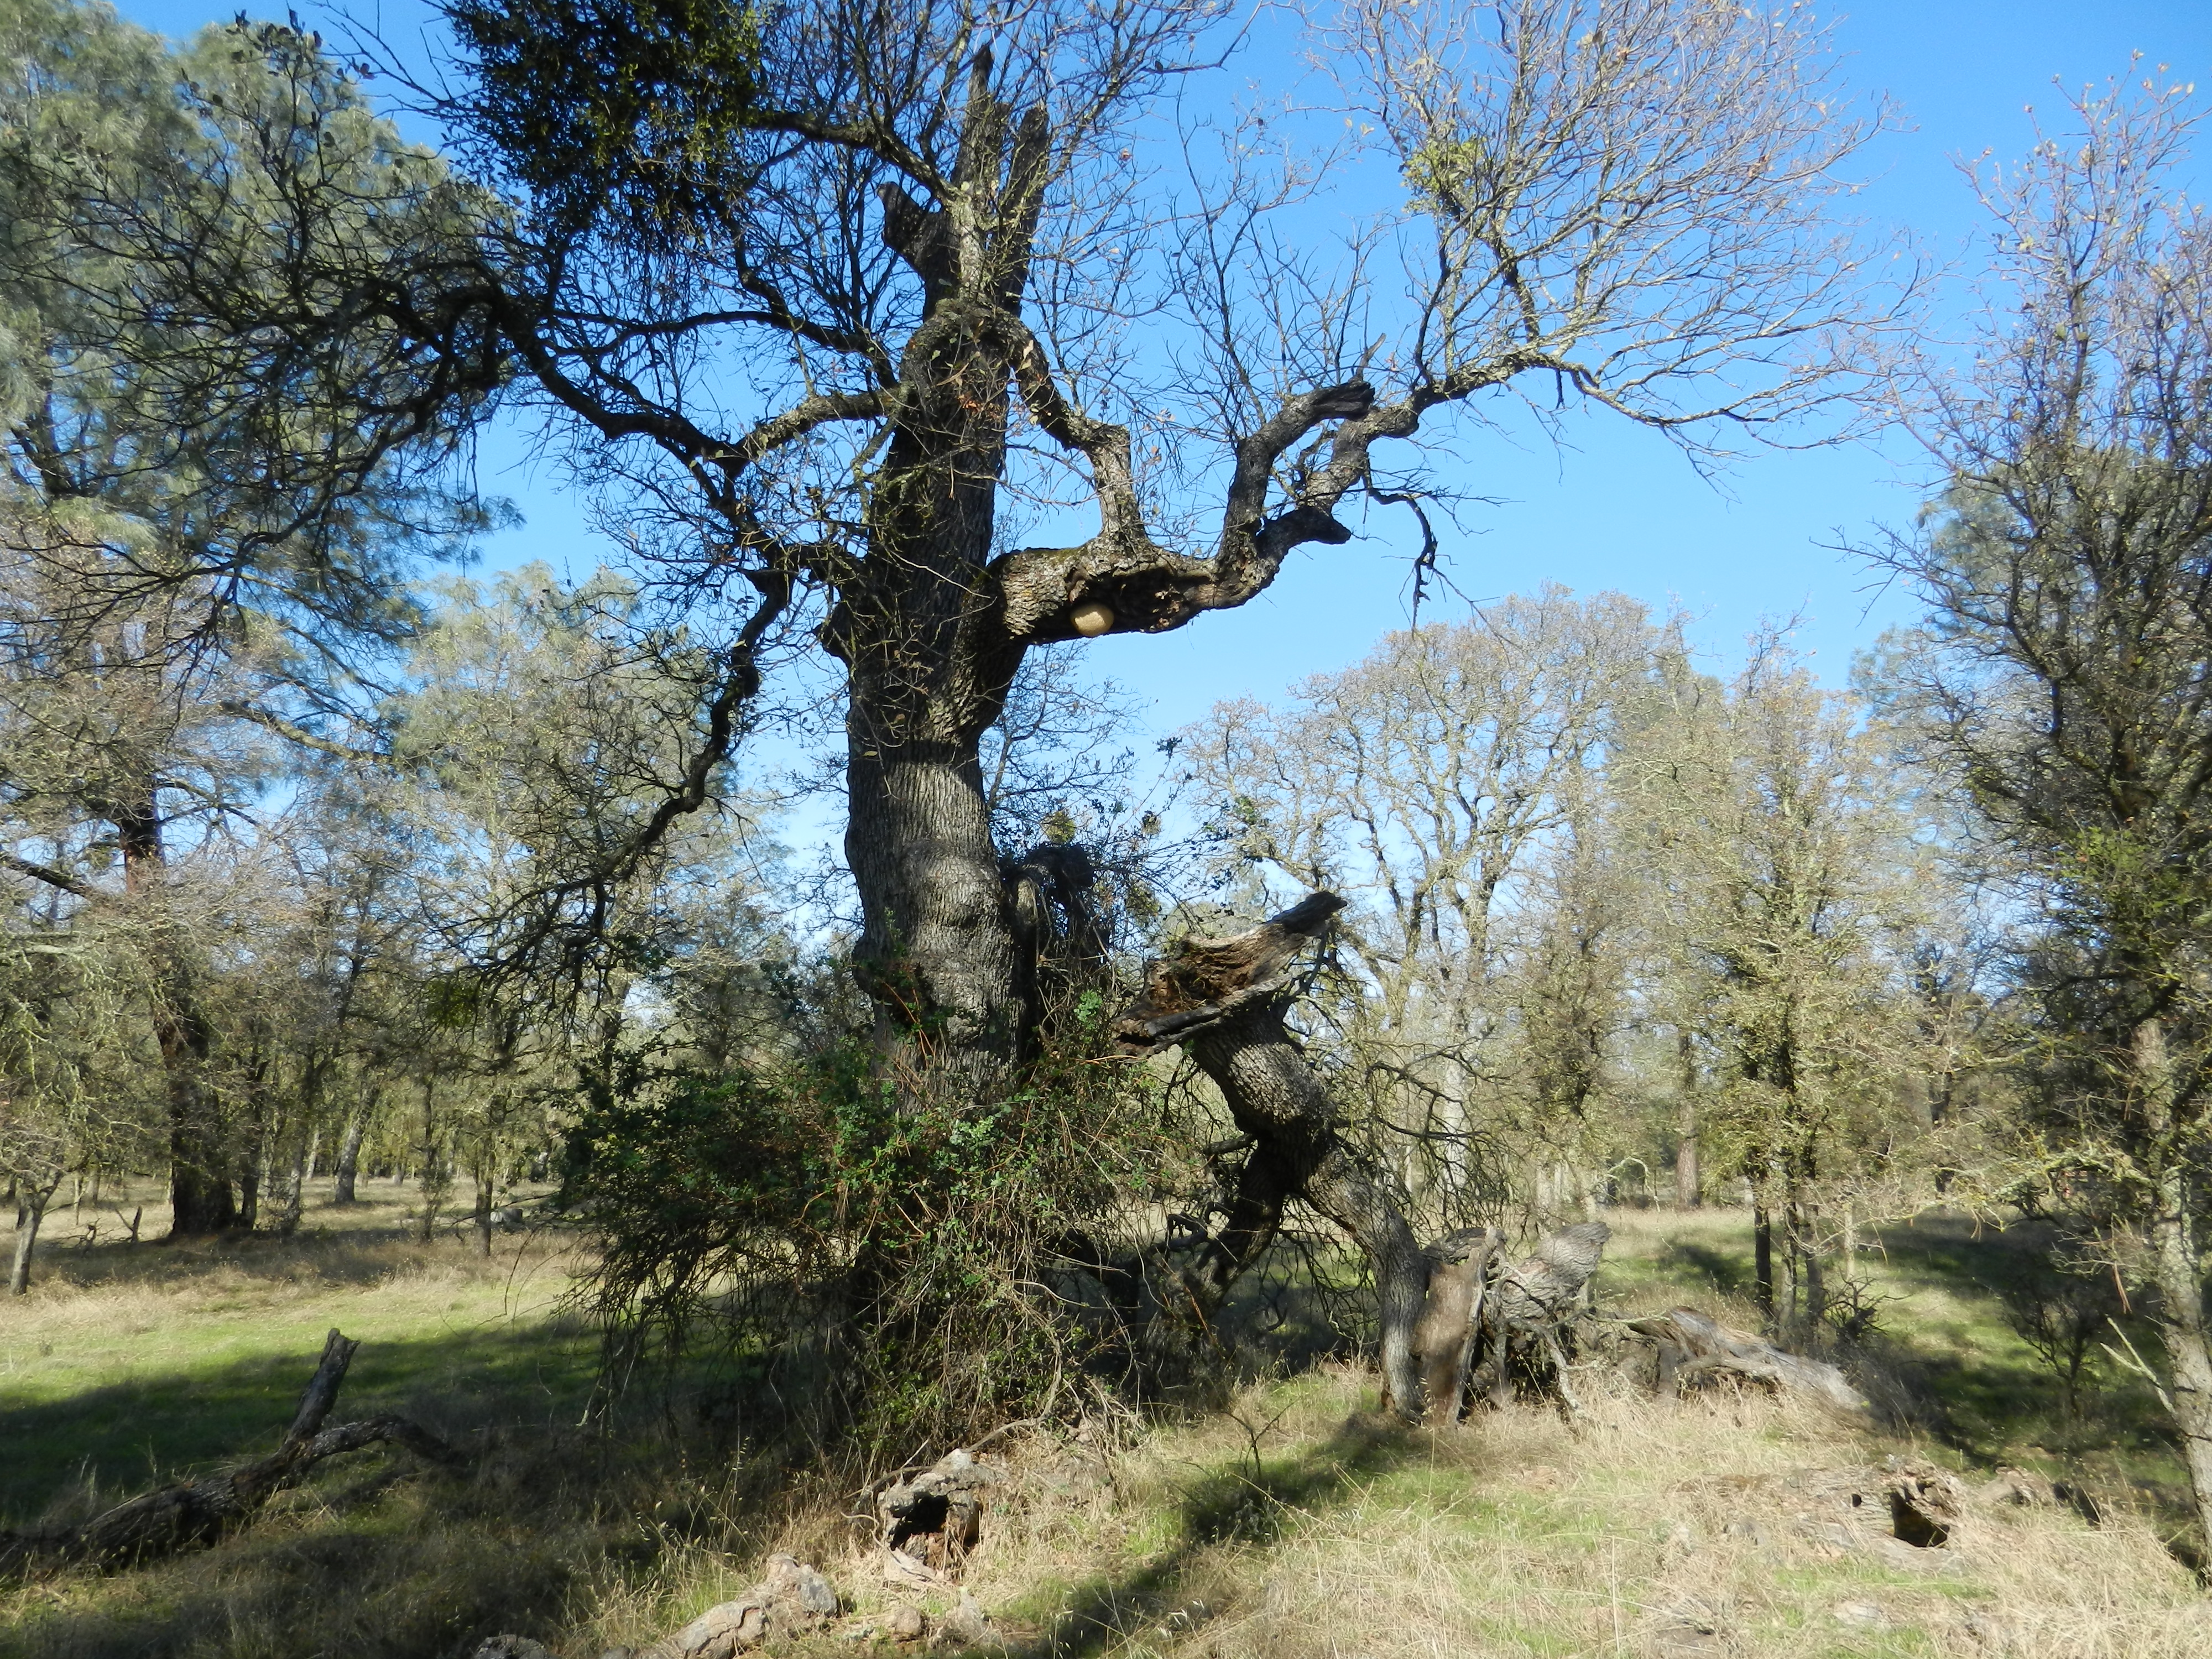
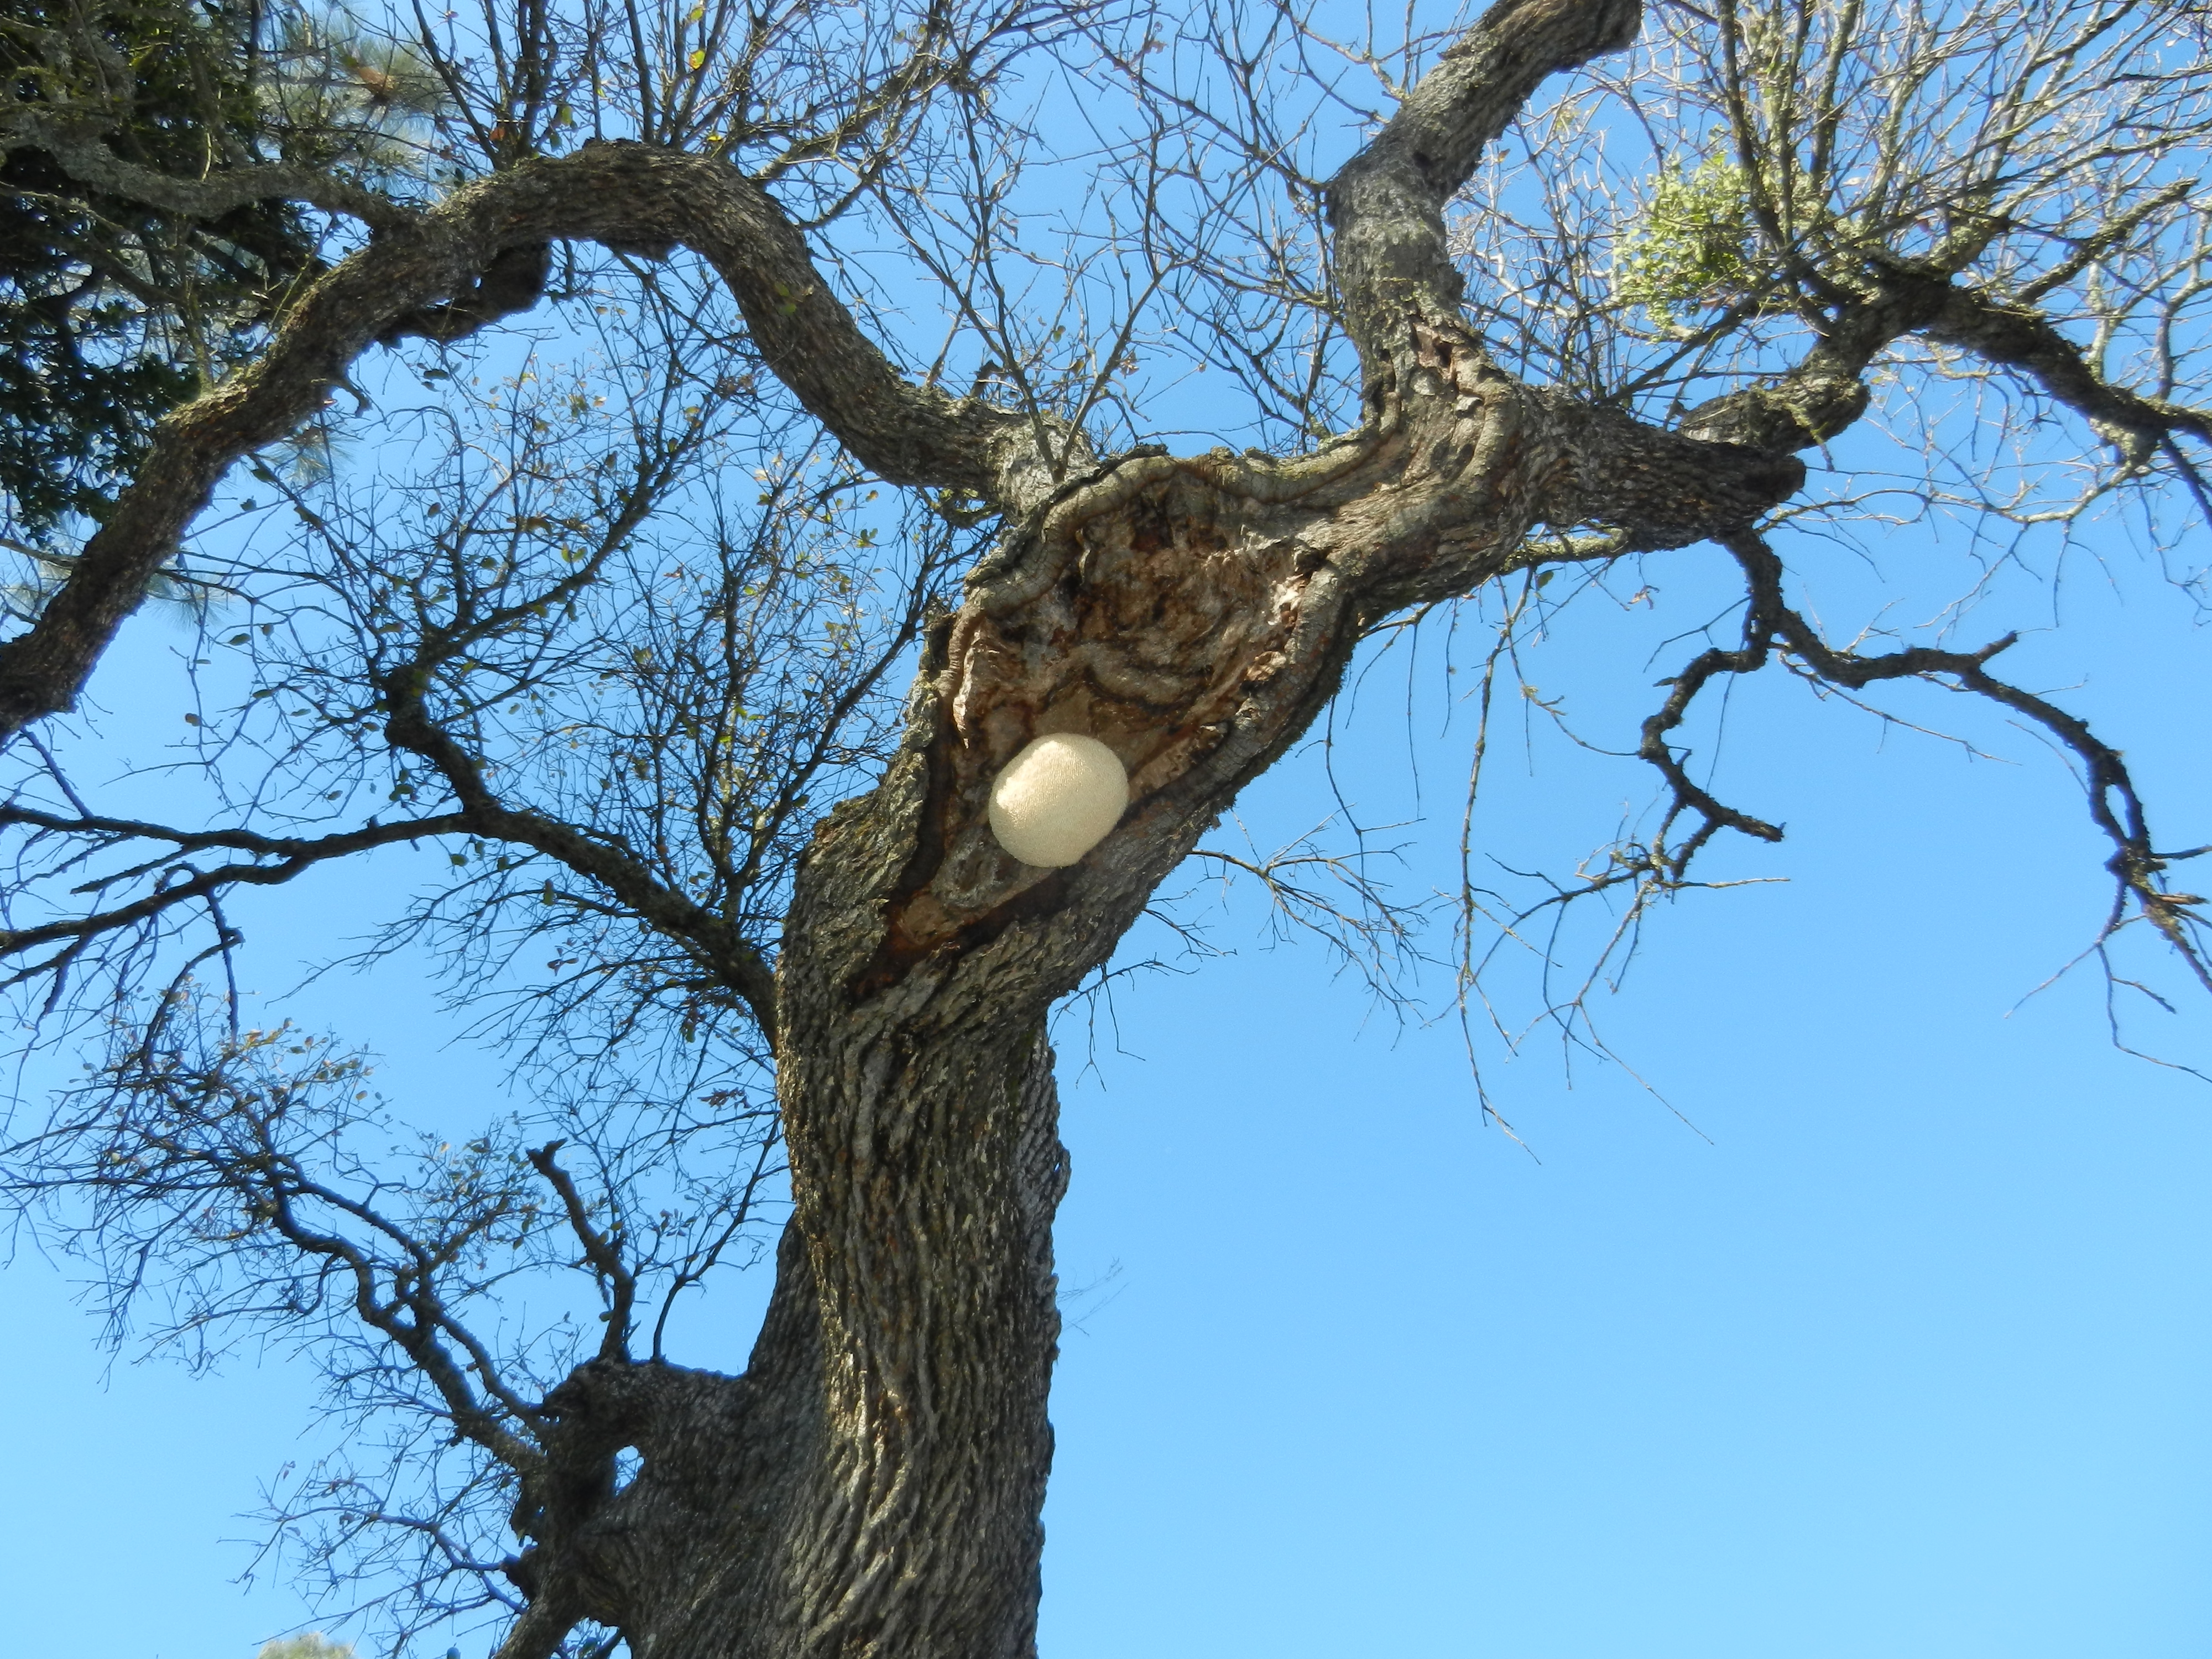
20111201TZ_TreeFungus2.jpg ( 2011-12-01 14:16:12 ) Full size: 4000x3000
Lion's mane fungus on oak tree
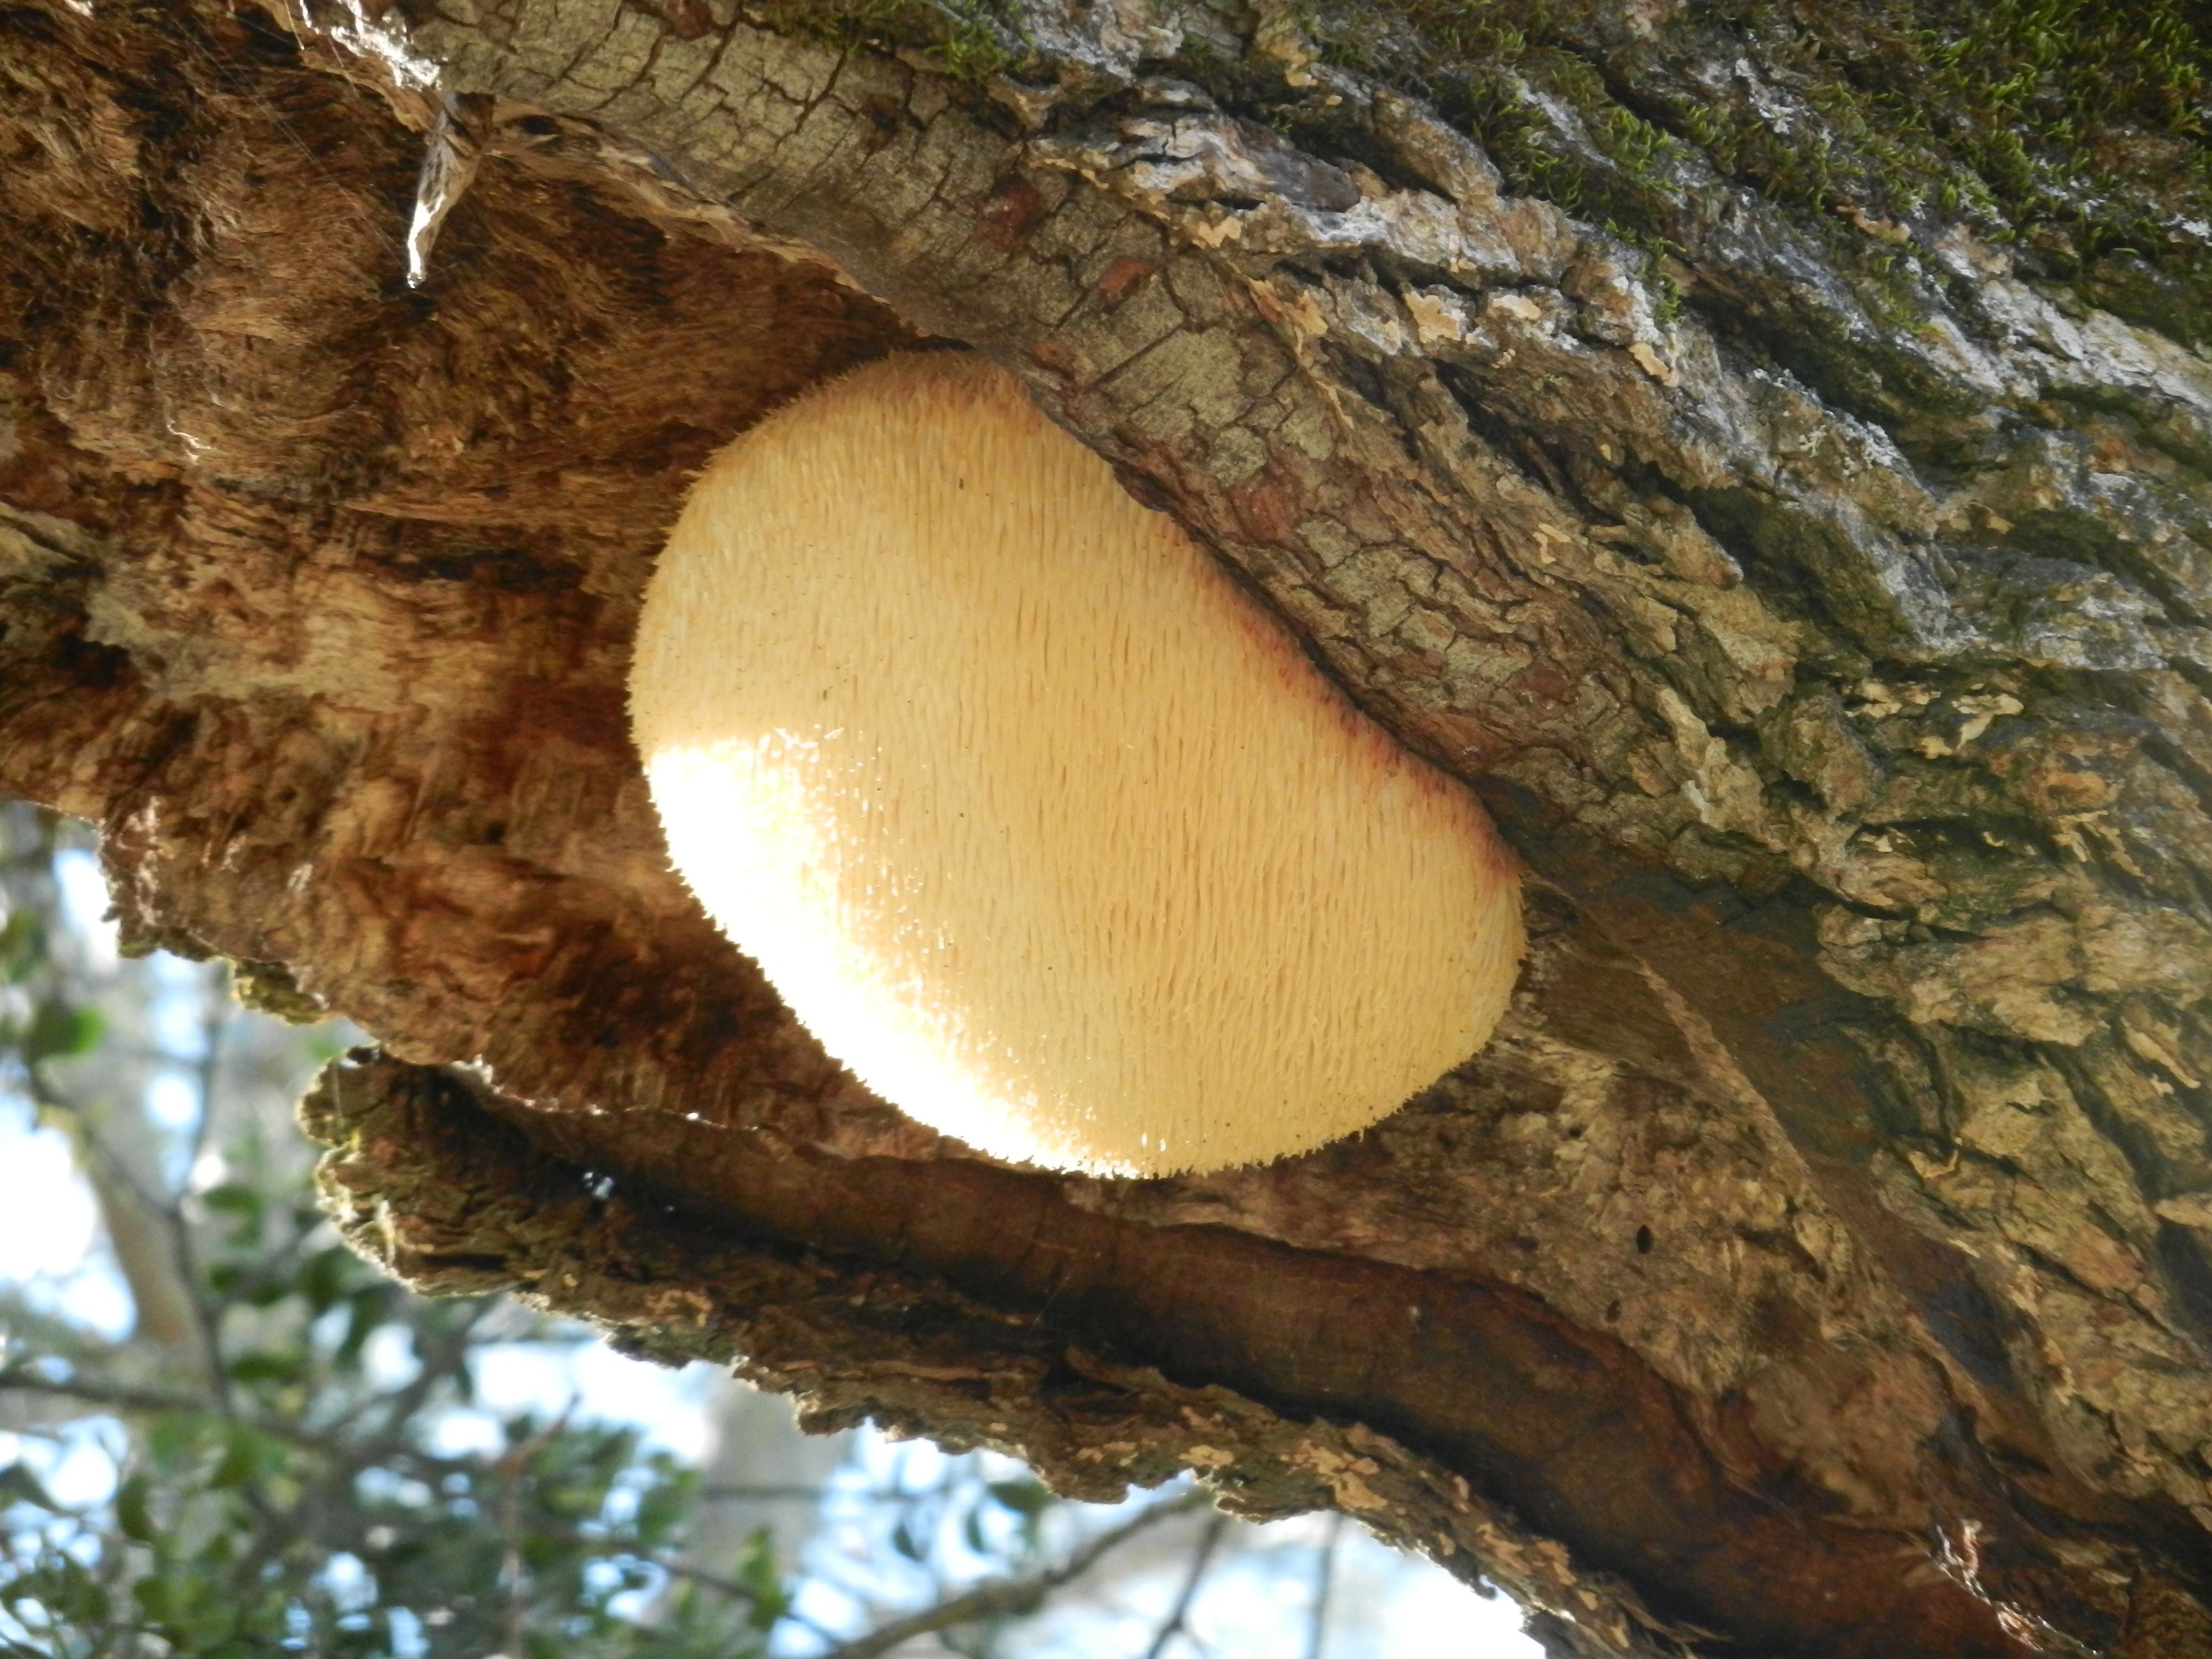
20111201TZ_TreeFungus3.jpg ( 2011-12-01 14:16:35 ) Full size: 4000x3000
Lion's mane fungus on oak tree
20111201TZ_TreeFungus4.jpg ( 2011-12-01 14:17:21 ) Full size: 4000x3000
Lion's mane fungus on oak tree
20111201TZ_TreeFungus5.jpg ( 2011-12-01 14:19:10 ) Full size: 4000x3000
Lion's mane fungus on oak tree
16 sets found
No data found for TZ_Fenergy.
11 TZ_tmet graphs found
11 TZ_soilco2 graphs found
Can't check TZ_mixed
3 TZ_mixed graphs found
1 TZ_fflux graphs found
8 TZ_fmet graphs found
1 TZ_tram graphs found
3 TZ_co2prof graphs found
No data found for TZ_irt.
No data found for TZ_windprof.
1 TZ_tflux graphs found
2 TZ_sm graphs found
Can't check TZ_met
1 TZ_met graphs found
Can't check TZVR_mixed
No data found for TZ_osu.
No data found for TZ_fd.
Tonzi Z-cam data