
Field Notes
<--2011-11-02 10:00:00 | 2011-11-16 12:00:00-->Phenocam link: Searching...
Tonzi: 2011-11-09 09:20:00 (DOY 313)
Author: Siyan Ma
Others:
Summary: Standard field work.
|
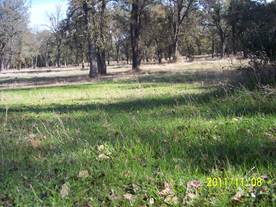
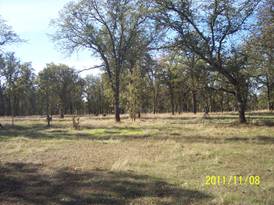
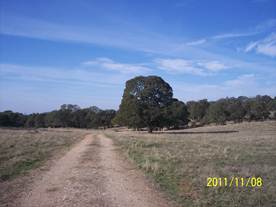
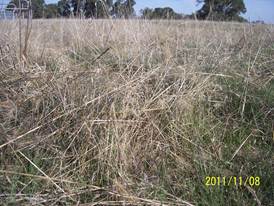
Pond When: Date: 11/09/2011 , Day: 313 , Watch Time: 9:20 am Where: Tonzi/Vaira Ranch Who: Siyan Weather: clear with light cloud, dew on grass leaves, cows at Tonzi Phenology: grass mixed with standing litter=gree+yellow, 50% oak leaves turned into brown or yellow.
Summary
Vaira_Grass Site
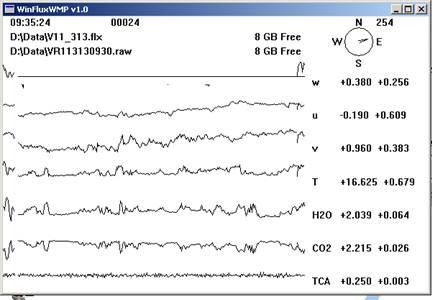
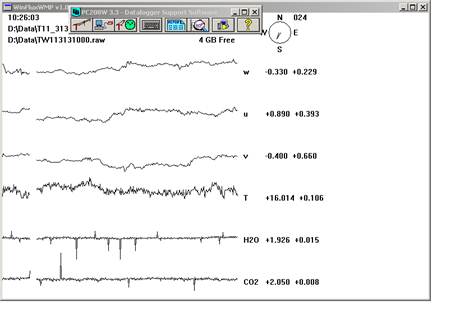
Tonzi_Tower Site
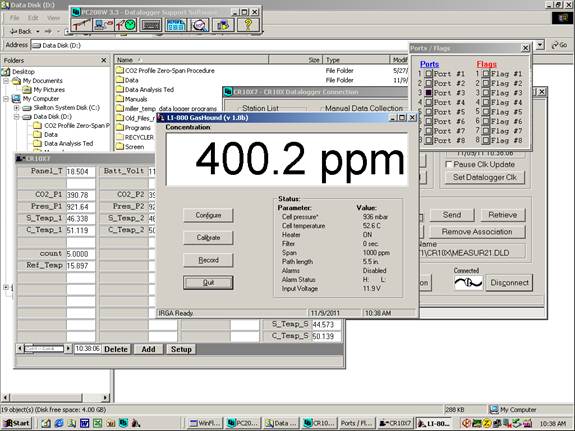
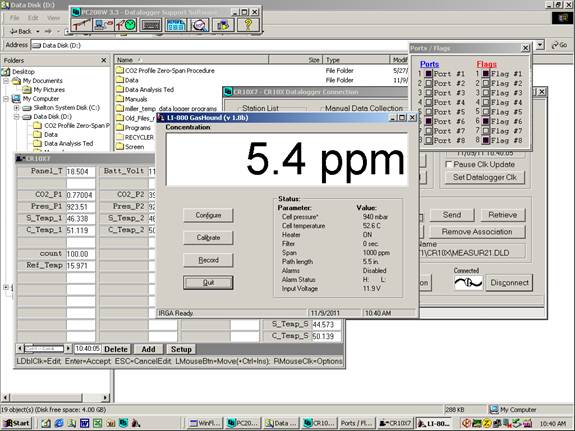
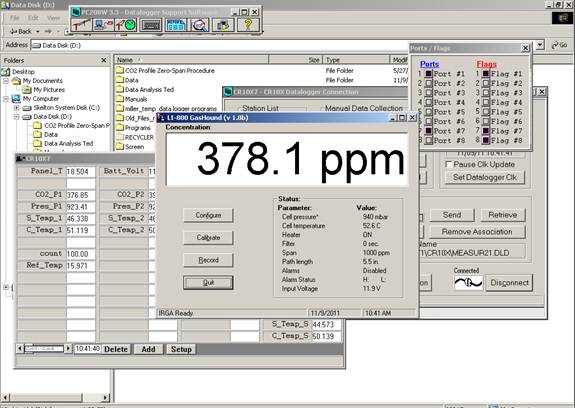
CO2 500 psig; flow 20 psi; 384.08 ppm. N2 1100 psig; flow 20 psi. Manually calibrate Li-800. Following Ted?s instruction: H:\IoneSavanna_2004\Tower_2004\CO2Profile\LI800_Calibration_Procedure_2Nov04.txt Is the pump running YES. 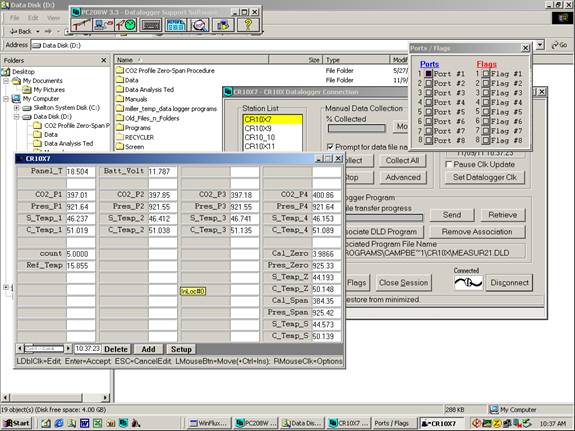
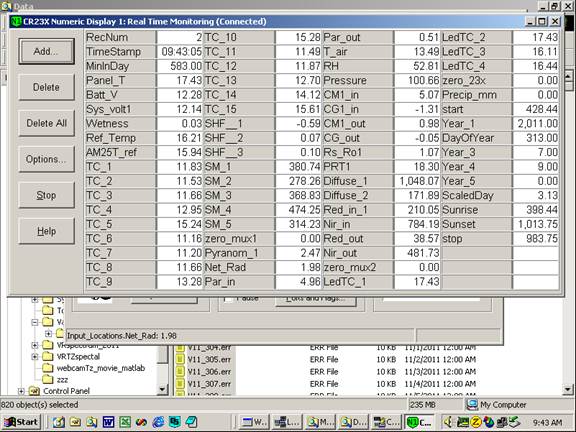
Toniz_Floor Site
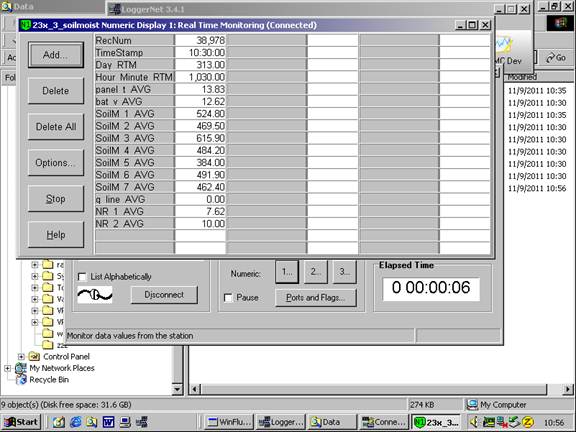
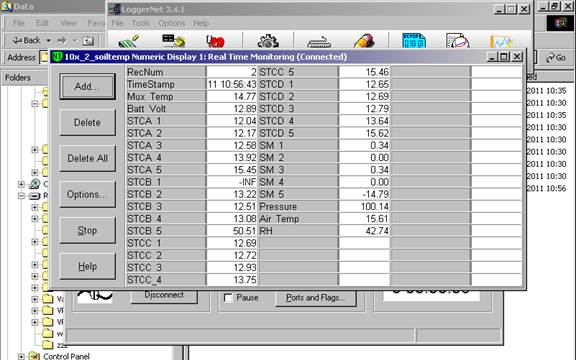
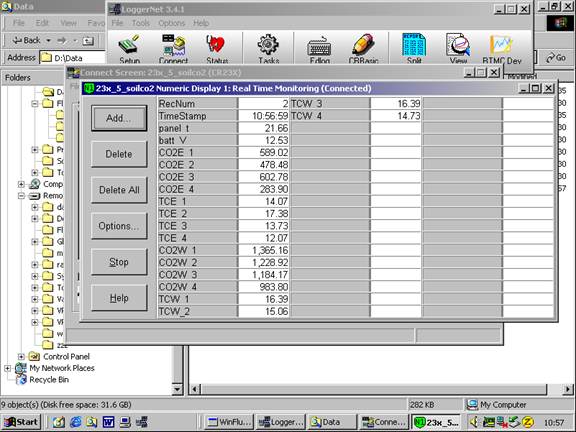
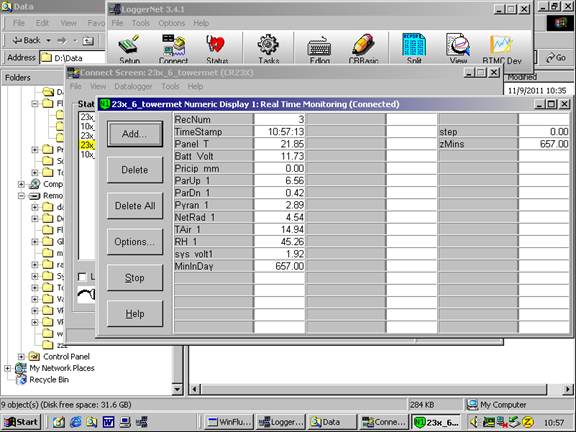
CR23X3 ? floor-Met CR23X5 ? soil CO2 profile CR23X6 ? tower-Met CR10X2 ? floor-Met 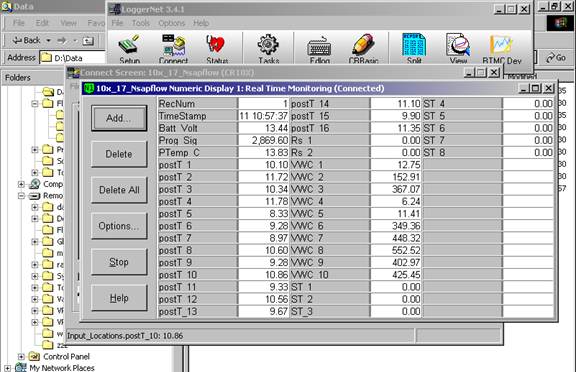
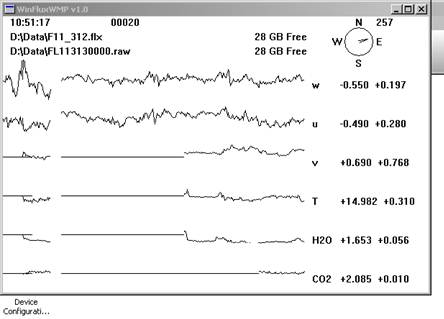
Reading from panels of analyzers
Notes: ?X? means not working any more. Dendrometers installed by Gretchen group 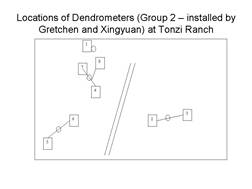
| ||||||||||||||||||||||||||||||||||||||||||||||||||||||||||||||||||||||||||||||||||||||||||||||||||||||||||||||||||||||||||||||||||||||||||||||||||||||||||||||||||||||||||||||||||||||||||||||||||||||||||||||||||||||||||||||||||||||||||||||||||||||||||||||||||||||||||||||||||||||||||||||||||||||||||||||||||||||||||||||||||||||||||||||||||||||||||||||||||||||||||||||||||||||||||||||||||||||||


Field Data
No tank data
Well Depth
| Date | Location | Depth (feet) |
|---|---|---|
| 2011-11-09 | TZ_floor | 26.8 |
| 2011-11-09 | TZ_road | 36.7 |
| 2011-11-09 | TZ_tower | 32.3 |
No TZ Moisture Point data found
No VR Moisture Point data found
No TZ grass heigth found
No VR grass heigth found
No TZ Tree DBH found
Water Potential - mode: raw
| Time | Species | Tree | readings (bar) | ||||
|---|---|---|---|---|---|---|---|
| 2011-11-09 11:46:00 | OAK | UNKNOWN | -26.5 | -21.2 | -19 | -22 | -25 |
| 2011-11-09 11:46:00 | PINE | OLD | -15 | -17.5 | -5 | ||
| 2011-11-09 11:46:00 | PINE | YNG | -5 | -3 | -18 | ||
No TZ Grass Biomass data found
No TZ OakLeaves Biomass data found
No TZ PineNeedles Biomass data found
0 photos found
16 sets found
No data found for TZ_Fenergy.
11 TZ_tmet graphs found
11 TZ_soilco2 graphs found
Can't check TZ_mixed
3 TZ_mixed graphs found
1 TZ_fflux graphs found
8 TZ_fmet graphs found
1 TZ_tram graphs found
3 TZ_co2prof graphs found
No data found for TZ_irt.
No data found for TZ_windprof.
1 TZ_tflux graphs found
2 TZ_sm graphs found
Can't check TZ_met
1 TZ_met graphs found
Can't check TZVR_mixed
No data found for TZ_osu.
No data found for TZ_fd.
Tonzi Z-cam data