Field Notes
<--2011-07-06 11:00:00 | 2011-08-09 09:30:00-->Other sites visited today: Vaira
Phenocam link: Searching...
Tonzi: 2011-07-20 12:30:00 (DOY 201)
Author: Joe Verfaillie
Others: Siyan
Summary: Change z-cam 1 and 2 program to sunset version, measured tower instruments.
| Tonzi
2011-07-20 I arrived about 12:30 with Siyan. It was sunny, clear and hot. There was a nice breeze from the west but it seemed to vary from northwest to southwest. The grass is almost completely dead with only a hint or green and a few flowers in low shady spots. The trees look good. The big oak by the road had quite a few acorns starting. I didn’t notice acorns on the other trees. I checked the z-cams cleaning their windows. I updated the program on the CR10X that controls z-cam one and two. The new program uses a 5th order polynomial to approximate the time of sunset and takes four photos at sunset-3hr, -2hr, -1hr and at sunset. I did the moisture point measurements. The tram was running. I brought out one of the mis-ordered 2% CH4 tanks to give Siyan a higher pressure for water potential. The new tank was at about 1000psi and old N2 tank was at 500psi which is just about the water potential of the leaves. I measured the height of things on the tower: The IRGA and sonic centers are 23.5m above ground The HMP45 and radiometers are 21.7m above ground CO2 profile inlets are at 22.82m, 5.96m, 1.80m and 0.47m above the ground Solar panels are at 18.00m, 16.16m, 14.31m and 12.49m I check on which program is currently loaded for the CO2 profile system: MEASUR21.DLD, and copied it to flash memory. I brought in the unused box with solar charger controller just west of the base of the tower. |
Field Data
No tank data
Well Depth
| Date | Location | Depth (feet) |
|---|---|---|
| 2011-07-20 | TZ_floor | 17.65 |
| 2011-07-20 | TZ_road | 27.15 |
| 2011-07-20 | TZ_tower | 22.9 |
No TZ Moisture Point data found
No VR Moisture Point data found
No TZ grass heigth found
No VR grass heigth found
No TZ Tree DBH found
Water Potential - mode: raw
| Time | Species | Tree | readings (bar) | |||||
|---|---|---|---|---|---|---|---|---|
| 2011-07-20 12:06:00 | OAK | UNKNOWN | -28 | -35 | -23.5 | -9 | -24 | -31 |
| 2011-07-20 12:06:00 | PINE | OLD | -18 | -19 | -19 | -19 | ||
| 2011-07-20 12:06:00 | PINE | YNG | -5 | -2 | -5 | -21 | ||
No TZ Grass Biomass data found
No TZ OakLeaves Biomass data found
No TZ PineNeedles Biomass data found
2 photos found

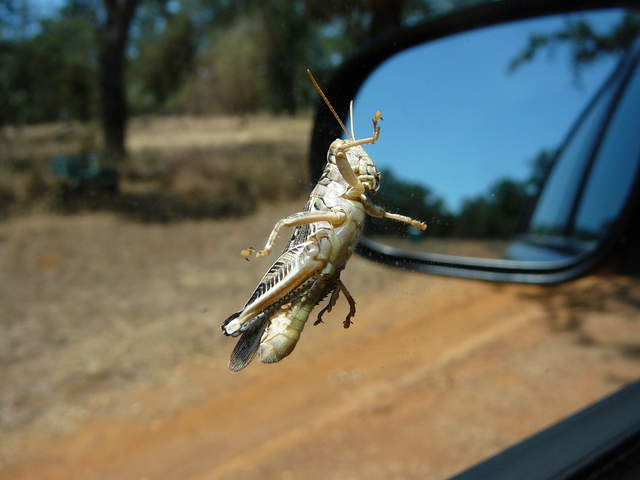
20110720TZ_Grasshopper.jpg ( 2011-07-20 11:18:48 ) Full size: 2560x1920
Grasshopper on car window

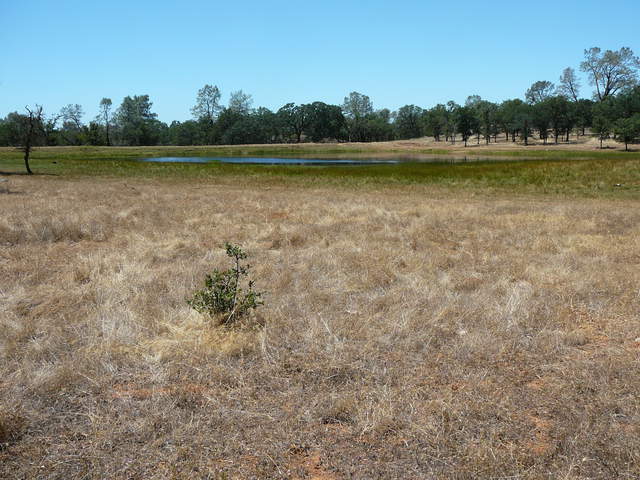
20110720TZ_TonziPond.jpg ( 2011-07-20 11:16:54 ) Full size: 2560x1920
A little water ringed with green grass in the Tonzi pond
16 sets found
No data found for TZ_Fenergy.
11 TZ_tmet graphs found
11 TZ_soilco2 graphs found
Can't check TZ_mixed
3 TZ_mixed graphs found
1 TZ_fflux graphs found
8 TZ_fmet graphs found
1 TZ_tram graphs found
3 TZ_co2prof graphs found
No data found for TZ_irt.
No data found for TZ_windprof.
1 TZ_tflux graphs found
2 TZ_sm graphs found
Can't check TZ_met
1 TZ_met graphs found
Can't check TZVR_mixed
No data found for TZ_osu.
No data found for TZ_fd.
Tonzi Z-cam data

