
Field Notes
<--2024-02-12 10:05:00 | 2024-03-07 10:00:00-->Other sites visited today: Mayberry | West Pond | East End | Bouldin Corn | Bouldin Alfalfa
Phenocam link: Searching...
Gilbert Tract: 2024-02-28 09:15:00 (DOY 59)
Author: Daphne Szutu
Others: Joe, Rob, Gigi
Summary: Rob Rhew and his student took soil samples, removed NDVI sensors, updated met program to fix typo in Bowen calculation, installed Song Meter Micro, another break in ADCP cable--fixed for now, tules coming up
| 2024-02-28 Gilbert Tract Joe and I arrived around 9:15 PST and met Rob Rhew and his student Gigi. They will be taking wetland soil samples today to test in an incubator back on campus. They are able to mimic the changing water level of tides in the incubator as well, cool! They walked west along the degraded road south of our tower to take a few 10cm cores and a gallon of wetland water home with them. It was warm and sunny with great visibility. There is cattail fluff everywhere, but at least there wasn't much of a breeze today. Lots of green tules coming up along the patch edges. We didn’t really see any new cattails though. Joe tightened the slack on the armored power line from the solar scaffolding side. The extension cable that runs from the datalogger enclosure to the “extension” box on the boardwalk pier was getting buried under last year’s litter and had some tension. I disconnected it from the “extension” box. Joe pulled it back in toward the datalogger enclosure and threw it back to me over the top of the litter, where I reattached it to the “extension” box. Should be ok as long as we reset it every year. The staff gauge read 73cm at 10:02 PST. I downloaded met, cam, and USB GHG data. I updated the eddy clock +1min from 9:56 to 9:57 PST and restarted logging. The wash reservoir was 2/3 full; we refilled it. Joe cleaned flux and rad sensors. We removed the NDVI sensors because they have been drifting: sn 2046503404 and sn 882103059 were removed. I uploaded a new CR1000 program that removes the NDVI columns, removes the PRI orientation columns, and changes a typo in the Bowen calculation so the qsat calculation uses esat instead of ea. Joe cleaned flux and rad. The wash reservoir was 2/3 full; he refilled it. We deployed the Song Meter Micro in the same place as before, ziptied to the upper level of the tower on the north side. I turned it on, synched its time and location with my phone, and put in a fresh desiccant pack. The 7500 read: 456ppm CO2, 410mmol/m3 H2O, 17.0C, 101.8kPa, 102SS -- 103 after cleaning The 7700 read: 2.17ppm CH4, 42RSSI – 85 after cleaning I measured the surface water conductivity off of the boardwalk pier at 10:28 PST. Sample, Temperature-compensated conductivity, Temperature Surface, 395 uS, 10.0 degC We went to the channel around 10:30 PST maybe to download Flo’s data. Unfortunately, I couldn’t connect again because there was ANOTHER clean-ish break in the ADCP cable. This time it was much closer to the railing, so for now we’ve repaired it with a screw terminal. The outside material of the ADCP is slippery and tough—I’m impressed with whatever tool/teeth snipped it. There was only one data point in the file, from the day of our last site visit. Maybe the cable was already mostly cut at that time, and maybe we stepped on it or something to finally make it break? In any case, next time we will solder the connection and put the whole wire in aluminum conduit. For now, Joe got the well pipe from the main tower and we put as much of the exposed cable in that as possible to protect it. I reset the ADCP clock and restarted logging. I waited for the real-time data to show up, which looked reasonable. We left at 11:30 PST. |
3 photos found

20240228GT_AdcpBox.jpg ( 2024-02-28 11:29:43 ) Full size: 1440x1920
Using a well pipe to temporarily protect the ADCP cable because it's been cut twice in the last month. We will put it in metal conduit next time.
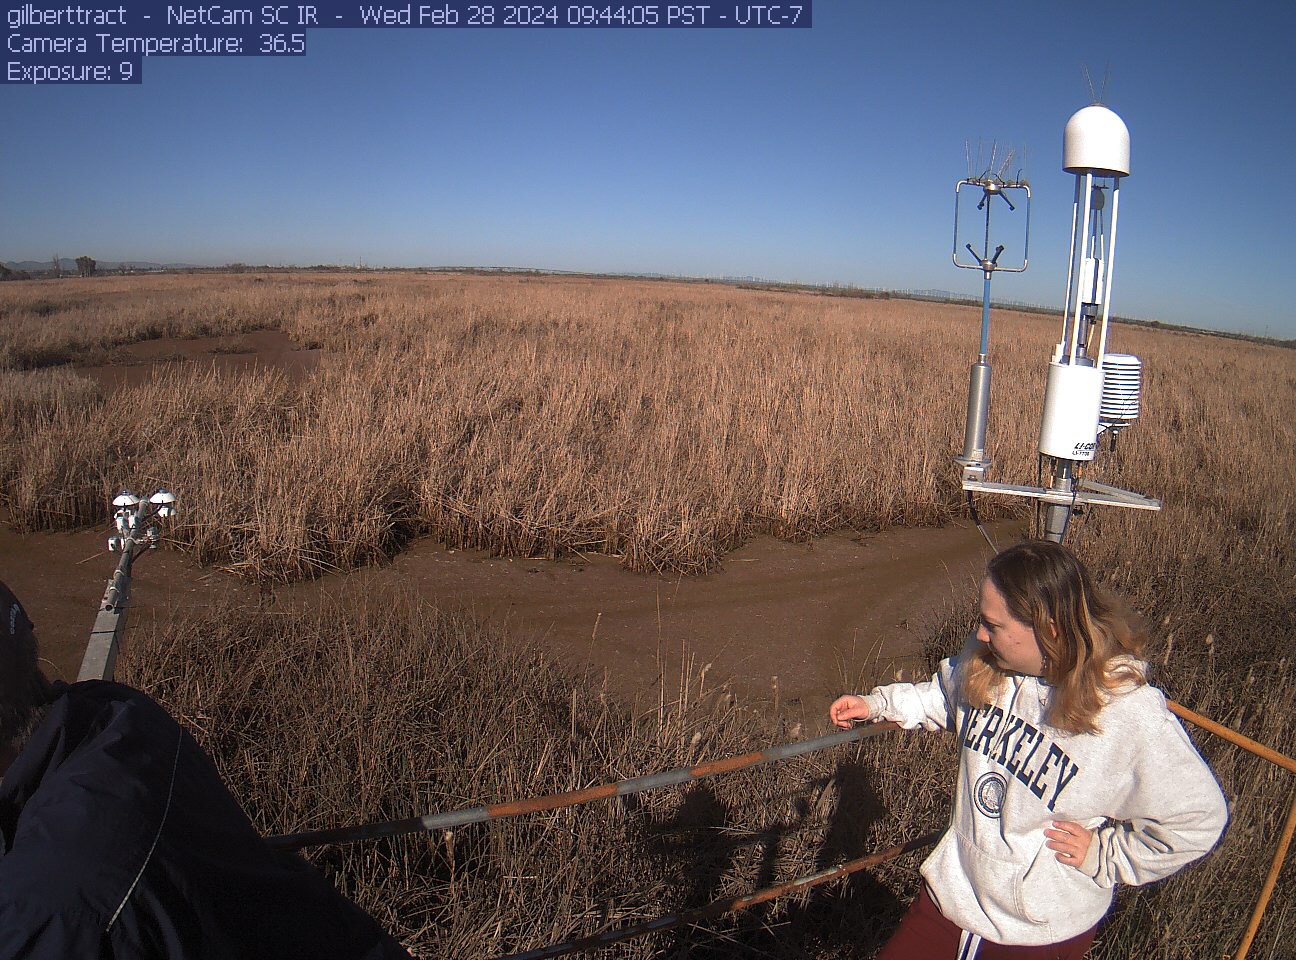
gilberttract_2024_02_28_094406.jpg ( 2024-02-28 17:50:16 ) Full size: 1296x960
Visitors on the GT tower
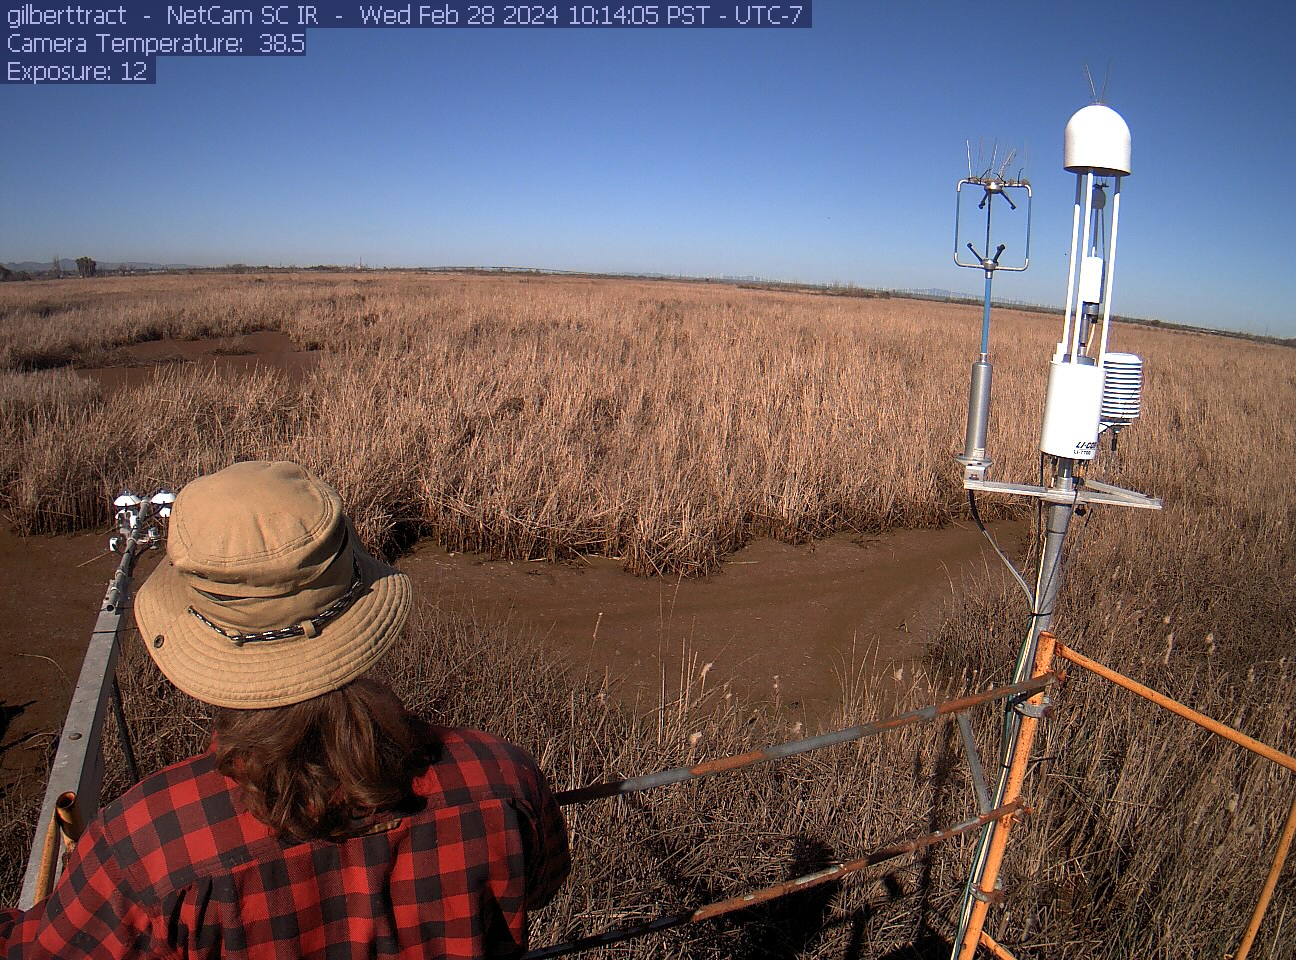
gilberttract_2024_02_28_101405.jpg ( 2024-02-28 18:20:14 ) Full size: 1296x960
Joe on the tower at GT
8 sets found
Can't check MBWPEESWGT_mixed
Can't check MBEEWPSWEPGT_cam
16 GT_met graphs found
4 GT_flux graphs found
3 GT_adcp graphs found
1 GT_cam graphs found
2 GT_usgs graphs found
No data found for GT_chanexo.