Field Notes
<--2023-11-06 16:50:00 | 2023-12-07 16:05:00-->Other sites visited today: Bouldin Corn | Bouldin Alfalfa | West Pond | East End | Mayberry
Phenocam link: Searching...
Hill Slough: 2023-11-20 09:40:00 (DOY 324)
Author: Daphne Szutu
Others: Carlos, Ngoc
Summary: Regular data collection/cleaning, lovely fall morning
| 2023-11-20 Hill Slough Carlos, Ngoc, and I arrived at 9:40 PST. It was sunny and clear with a light breeze—another beautiful fall day in the Delta. We had a rainstorm two days ago but no major rain forecast for the next 10 days. It was near high tide and the staff gauge read 5.6ft at 9:53 PST. Carlos downloaded met, cam, and USB data and Ngoc cleaned flux and rad sensors. I supervised. The wash reservoir was ½ full; we refilled it. I also replaced the rad boom bolt. Last time Joe had to put in a temporary, shorter bolt because some of the threads on the lower part of the boom had worn out. The new bolt works great. I checked the conductivity from the sipper and surface water under the tower. Sample, Temperature-compensated conductivity, Sample temperature, Time Porewater, 8.23mS, 13.8C, 10:05 PST Surface, 6.70mS, 11.4C, 10:06 PST The 7500 read: 425ppm CO2, 282mmol/m3 H2O, 19.0C, 104kPa, 99SS – 102 after cleaning The 7700 read: 2.1ppm CO2, 42RSSI – 72 after cleaning We left at 10:10 PST. Looking at the EXO data in the lab, fDOM has been steadily decreasing since the the last time it was installed in mid-October and has been ~0 for the last two weeks. I'll pull it up next time to check that it's clean. |
1 photos found

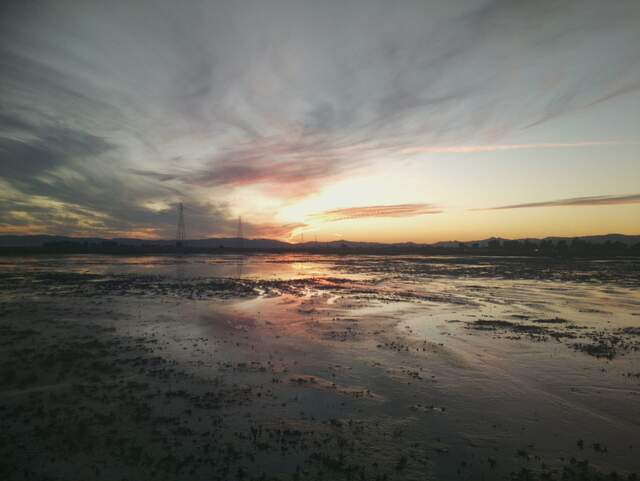
HS_picam_20231121_1715.jpg ( 2023-11-21 17:15:05 ) Full size: 1917x1440
Nice sunset at low tide
4 sets found
21 HS_met graphs found
4 HS_flux graphs found
1 HS_cam graphs found
Can't check HS_Processed
2 HS_Processed graphs found

