Field Notes
<--2023-09-28 15:35:00 | 2023-10-27 11:30:00-->Other sites visited today: Gilbert Tract | West Pond | East End | Bouldin Corn | Bouldin Alfalfa | Hill Slough
Phenocam link: Searching...
Mayberry: 2023-10-11 12:15:00 (DOY 284)
Author: Daphne Szutu
Others: Kyle, Mel
Summary: Swapped 7500 for calibration, installed 1 replicate sipper, shadowband not working--fixed, blue-green algae maybe in water
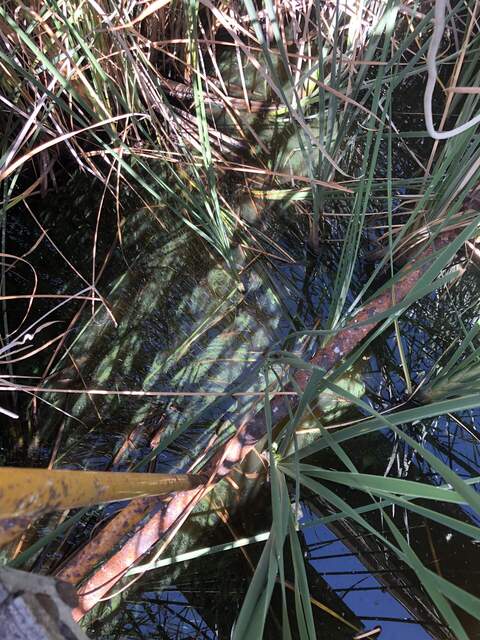
| 2023-10-11 Mayberry Kyle, Mel, and I arrived at 12:15 PDT. Mel is a new grad student in Iryna’s lab interested in mammal/bird benefits from wetland restoration projects. It was sunny and mild with a light breeze. There was a lot of white poopy liquid on the boardwalks and on the nearby plant canopy. Some of the cattail looks chewed, but no widespread damage from caterpillars yet. The staff gauge read 32cm. There was that same bright green swirled layer on the water surface; I thought it was pollen last visit but we decided it looked more like blue-green algae. There are no current warning in the Delta region: https://mywaterquality.ca.gov/habs/where/freshwater_events.html Kyle took porewater conductivity measurements and installed an additional sipper at 40cm (no mesh, labeled with black tape). Veg-black-bare, 5.15mS, 19.6C Veg-black-green, 10.36mS, 23.4C Veg-black-red, 7.65mS, 20.2C Veg-black-yellow, 13.6mS, 20.6C Veg-black-yellow, 13.22mS, 19.9C Surface, 2.8mS, 23.7C Mel cleaned flux and rad sensors. We lowered the eddy post and raised it back to the same position/height afterwards. Looking at the data, the RSSI has been pretty messy. Not sure if there were spiderwebs. The wash reservoir was ½ full; I refilled it. I downloaded met, cam, and USB GHG data. I downloaded the miniDOT data and changed the desiccant for the miniDOT and water level sensors. The rotating shadowband was not working. I changed its motor and all seemed well. There was a lot of crayfish-filled poop on the radiometer boom and on the picam enclosure, although the picam window remained clear. Since the shadowband was not working, birds could sit on the dfPAR enclosure and poop on the picam enclosure, which is just below the dfPAR enclosure. We swapped the 7500A for calibration: sn 75H-2182 came off and sn 0073 went on. I uploaded a new config file, updated the pressure coefficients, changed the eddy clock +1min from 11:38 to 11:39 PST to match the laptop time, and rest the box. 2182 read: 406ppm CO2, 477mmol/m3 H2O, 20.9C, 100.5kPa, 99SS 2182 clean read: 436ppm CO2, 331mmol/m3 H2O, 21.3C, 100.5kPa, 100SS 0073 fresh read: 408ppm CO2, 499mmol/m3 H2O, 21.7C, 100.7kPa, 102SS The 7700 read: 2.0ppm CH4, 39RSSI – 72 after cleaning We left at 13:10 PDT. |
1 photos found

20231011MB_BlueGreenAlgae.jpg ( 2023-10-11 13:07:02 ) Full size: 1440x1920
Maybe blue-green algae in the calm waters around the MB scaffolding
11 sets found
7 MB_flux graphs found
No data found for MB_met.
28 MB_tule graphs found
Can't check MBWPEESWGT_mixed
1 MB_cam graphs found
Can't check MBEEWPSWEPGT_cam
Can't check SIMBTWEE_met
1 MB_minidot graphs found
Can't check MBSWEEWPBCBA
1 MB_processed graphs found
Can't check MB_fd
1 MB_fd graphs found

