Field Notes
<--2023-03-02 12:20:00 | 2023-04-03 15:45:00-->Phenocam link: Searching...
Bouldin Alfalfa: 2023-03-13 11:50:00 (DOY 72)
Author: Daphne Szutu
Others: Bill, Ellie
Summary: Licor set up prototype ET sensor, regular data collection/cleaning, alfalfa very short and sparse, more rain on the way
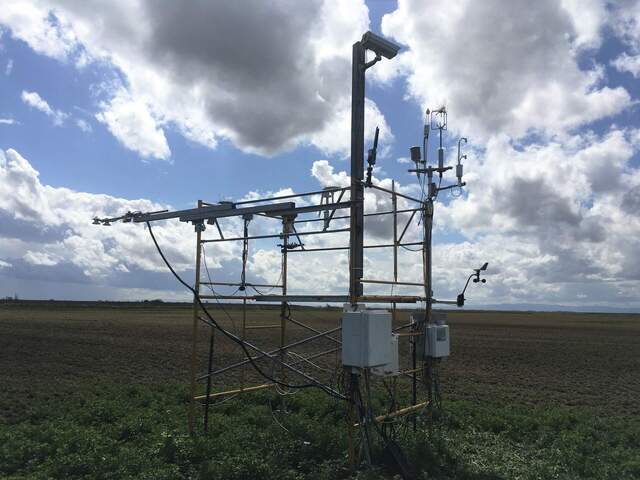
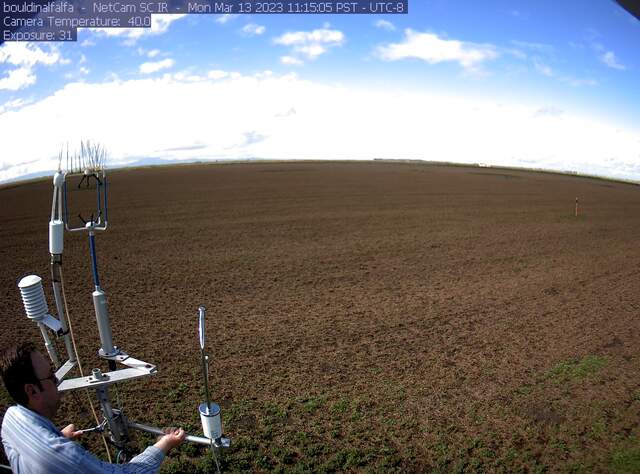
| 2023-03-13 Bouldin Alfalfa Bill and Ellie from Licor and I arrived around 11:50 PDT (first site visit since we started Daylight Savings Time). The Licor folks are here to set up a prototype ET sensor on our tower for testing. The new sensor has a 1-D sonic and a closed path analyzer for H2O and outputs 30-min ET. It was mild and partly cloudy with lots of cumulus clouds. We had an atmospheric river over the weekend and another one is expected tonight, so plenty of rain to come. The dirt road coming from the levee road down to the fields was still driveable in Licor’s rental minivan. We parked on the side of the field and walked in. The field has been so damp there is a green mold or biofilm in some areas of exposed soil. The alfalfa field was quite sparse except for the edges, the area around the tower, and the random splotches of green weeds. We walked by a few patches of stinging nettles. I guess the geese don’t like to eat those. There were a handful of awake wasps flying around, especially around the top of the scaffolding posts. I downloaded the usual data (met, cam, USB GHG, FD, and IRT) while Bill and Ellie got set up. I cleaned the radiometers but not the 7500 since it looked clean enough and it’s about to rain. The 7500 read: 418ppm CO2, 632mmol/m3 H2O, 19.5C, 101.8kPa, 104SS Bill set up the new sensor (LI-710 sn ET1-00039) just north and slightly below our sonic, and set up an antenna on the north side of the scaffolding. Ellie set up their datalogger box below our flux sensors, where the wash box used to go. The datalogger box has a Sutron datalogger, a radio, a fuse, and some screw terminals. Bill said the system will run on either 24V or 12V, so we plugged their system into our orange 24V power strip. Their fuse flipped off. Bill thought it was a bad fuse, so he removed the fuse from the wiring. We then tried again, but then our own fuse in the charge controller box flipped, so there was definitely a short somewhere. I looked up the manual for the Sutron datalogger on my phone and saw it only takes 10-16V. We connected the datalogger only to our 12V power strip but it was dead, probably blown by applying 24V on it. Luckily Licor had a spare datalogger among their equipment. They hooked it up, added the fuse back into their circuit, and we connected everything to our 12V power strip. Everything booted up, they double-checked their program, and all seems well. I volunteered to add a bird spike to their sensor the next time we are out here. I’ll also send them our .ghg files after every site visit. They will process it in EddyPro to compare with their ET sensor data. We left at 13:35 PDT. |
Next Mowing: 2023-05-10
2 photos found

20230313BA_LicorET.jpg ( 2023-03-13 13:23:52 ) Full size: 1920x1440
Licor set up a prototype ET sensor for testing along our regular flux sensors. Their prototype is a 1-D sonic + closed path H2O sensor which produces 30-min ET values.

bouldinalfalfa_2023_03_13_111505.jpg ( 2023-03-13 19:16:20 ) Full size: 1296x960
Bill from Licor setting LI710
7 sets found
4 BA_flux graphs found
21 BA_met graphs found
6 BA_arable graphs found
Can't check TATWBABCSB_cam
Can't check MBSWEEWPBCBA
2 BA_processed graphs found
No data found for BA_adex.

