
Field Notes
<--2022-08-03 10:20:00 | 2022-08-18 10:00:00-->Other sites visited today: Mayberry | West Pond | East End
Phenocam link: Searching...
Gilbert Tract: 2022-08-16 08:00:00 (DOY 228)
Author: Daphne Szutu
Others: Robert, Iryna, Eric, Dennis
Summary: Regular data collection/cleaning, Iryna and Eric's visit, 7500A stopped working a few days ago--removed, added Apogee NDVI sensors for inter-comparison, swapped miniDOT batteries
| 2022-08-16 Gilbert Tract Robert and I met Iryna, Eric (Iryna’s new PhD student), and Dennis at the gate at 8:00 PDT. Iryna and Eric wanted to see the wetland sites (especially the tidal sites) and Dennis came to chat with them. At the tower, it was mild and breezy, but it will be hot later in the day. The horizons were hazy but it was otherwise clear. The water level was high but ebbing. The staff gauge read 83cm at 8:20 PST. I downloaded met, cam, and USB GHG data. There were plenty of dead ants and still a few live ants in the met box. I swept out the dead ants and left some more mothballs in the met and 7550 boxes. I downloaded miniDOT data and swapped the miniDOT desiccant and batteries. I turned on the miniDOT before redeploying it. CO2/H2O numbers were ok when I first connected, but when I checked a few minutes later they were both **.**. The sonic and 7700 data all look fine, so the problem is most likely with the 7500A. Both ends of the cable look ok and the 7500 connector looked fine. There was some cattail fluff on the connector at the bottom of the IRGA. I cleaned it with canned air but it didn’t solve the problem. I checked the .ghg files and the problem just started yesterday on 2022-08-15. I removed the sensor sn 75H-2182 and brought it back to the lab for testing. The IRGA cable and 7550 box remain on site. I changed the eddy clock +1min from 7:41:30 to 7:42:30 and restarted logging. Eric and Iryna took turns climbing the tower. Robert and Eric cleaned flux and rad sensors. I topped off the wash reservoir. We added an Apogee NDVI set sn 1049 and sn 1050 to compare with the Decagon sensors. Decagon 650in fell by about 1/3 over a week or so in late May. The Apogee are wired to the main met CR1000 and stored in a separate 30-min data table. TC18 has had much larger diurnal swings recently so I tightened its wiring—it wasn’t particularly loose beforehand though. Dennis left to go back to campus for his lunchtime meeting. The rest of us drove down to the channel and got to Flo around 10:00 PDT. It was starting to warm up. I connected to the SL and declined to set the time. I downloaded the data and noticed the last data point was from 8:45 PST even though the download was around 9:00 PST—there should be data points every 5 minutes. Maybe the clock is slightly off. I stopped logging, disconnected, and reconnected. This time I accepted the prompt to synch the SL and laptop time, although I still declined to reset the site memory or to calibrate the pressure sensor. Next time I should check if the last data point is closer to the current laptop time. The 7500 read: 421ppm CO2 --> **.** , 865mmol/m3 H2O --> **.**, 25.2C, 101.2kPa, 89SS – **.** The 7700 read: 2.08ppm CH4, 39RSSI – 86 after cleaning We left around 10:30 PDT. |
2 photos found
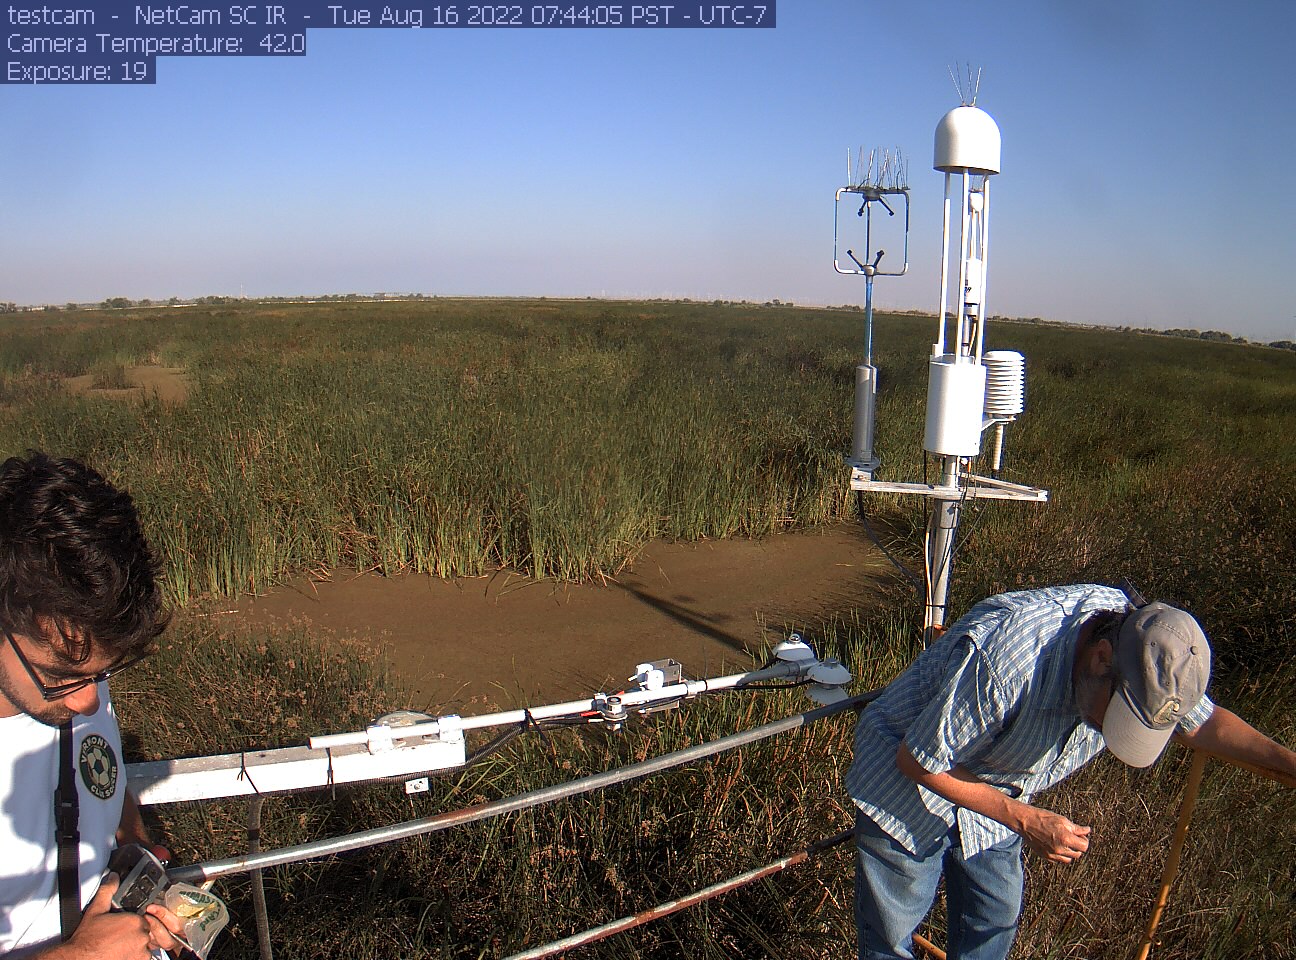
gilberttract_2022_08_16_074405.jpg ( 2022-08-16 08:48:18 ) Full size: 1296x960
Eric and Dennis on site

gilberttract_2022_08_16_081406.jpg ( 2022-08-16 09:18:16 ) Full size: 1296x960
Robert cleaning radiometers
8 sets found
Can't check MBWPEESWGT_mixed
Can't check MBEEWPSWEPGT_cam
16 GT_met graphs found
4 GT_flux graphs found
3 GT_adcp graphs found
1 GT_cam graphs found
2 GT_usgs graphs found
No data found for GT_chanexo.