
Field Notes
Can't get there from here<--2022-04-26 09:30:00 | 2022-05-13 08:45:00-->
Other sites visited today: Mayberry | West Pond | East End
Phenocam link: Searching...
Gilbert Tract: 2022-05-12 09:40:00 (DOY 132)
Author: Daphne Szutu
Others: Carlos
Summary: Regular data collection/cleaning, pushed SL off the rails twice--needs more work, camera card still missing sporadic photos, met datalogger program could use improvements, channel minidot recently deployed
| 2022-05-12 Gilbert Tract Carlos and I arrived at the breach site around 9:40 PDT. This was our second day of Delta field work. It was cool and windy with thin clouds covering most of the sky. It was just after low tide, so the water level was low but rising. I connected to the SL and downloaded data without any issues. However, the flow is becoming more muted with smaller daily amplitude day by day. Carlos and I pulled up the sensor and it seemed clean, so we pushed it down back the track…accidentally over the zip ties. We couldn’t pull the sensor back up with the handle, so I pushed the handle further down until the sensor was definitely off the track. Carlos got in the water and we lifted the sensor platform up and out of the water. We installed the platform from the top of the track after taking off the first crosspiece and rolling the wheels back onto the railings. I pushed the sensor down slowly, slowly to make sure we didn’t miss the ziptie…and pushed it over the zipties again. We could not pull it up via the handle. The water level had risen enough that we could no longer grab the sensor while reaching down through the water. After phone consultation with Joe and Ari, we decided it was ok for now (Ari would be visiting the site the following day for the field trip with elementary school students). We ziptied the top of the handle to the track to make sure the sensor would not float off anywhere. We arrived at the main tower at 11:35 PDT. I downloaded met, cam, and USB GHG data. Carlos cleaned flux and rad sensors and topped off the wash reservoir. I also downloaded the miniDOT data and changed its desiccant. The water sensors were barely in the water when we arrived. The card was missing about ¼ of its photos, with sporadic gaps. I need to take a closer look at the ethernet/power connections to the camera. There are some skipped scans in GTmet. Avg processing time ~6s, max processing time ~12s. This met program is the old one originally from SW and could be streamlined. LI-7500 readings: CO2 413ppm, H2O 420ppm, T 17.1C, P 102.5kPa, SS 97 --> 98 after cleaning LI7700 readings: CH4 2.0ppm, RSSI 40 --> 82 after cleaning We left at 11:55 PDT. Ari has given one of our extra miniDOTs sn 1221 to McKenna from USGS. They deployed it in the channel by the EXO on 2022-05-06. |
5 photos found
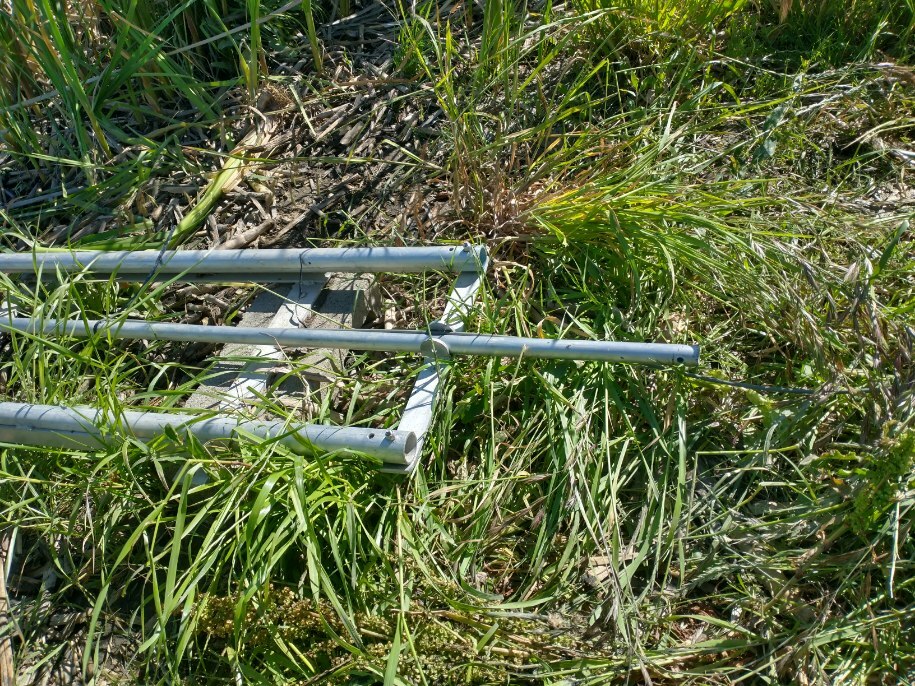
20220513GT_SL_mount_close.jpg ( 2022-05-13 00:00:00 ) Full size: 915x686
up photo of the upper end of the side looker mount. The central pole

20220512GT_GreenUp.jpg ( 2022-05-12 10:05:03 ) Full size: 1920x1440
Nice spring day and wetland is greening up

20220512GT_NewSign.jpg ( 2022-05-12 09:41:46 ) Full size: 1920x1440
New sign at the breach site. I suppose that it could possibly help prevent people from driving off the road

20220512GT_SLRails.jpg ( 2022-05-12 11:19:41 ) Full size: 1440x1920
Side Looker was pushed off the railing and the top of the handle was flush with the first cross piece

20220513GT_SAV.jpg ( 2022-05-13 00:00:00 ) Full size: 768x1024
Submerged Aquatic Vegetation at the ADCP site
8 sets found
Can't check MBWPEESWGT_mixed
Can't check MBEEWPSWEPGT_cam
16 GT_met graphs found
4 GT_flux graphs found
3 GT_adcp graphs found
1 GT_cam graphs found
2 GT_usgs graphs found
2 GT_chanexo graphs found