
Field Notes
<--2022-04-20 16:20:00 | 2022-05-12 09:40:00-->Other sites visited today: East End | Bouldin Corn | Bouldin Alfalfa
Phenocam link: Searching...
Gilbert Tract: 2022-04-26 09:30:00 (DOY 116)
Author: Daphne Szutu
Others: Carlos
Summary: Trouble connecting with ADCP Side-Looker, camera card had only a few photos--needs more attention, game cameras stolen, measured water sensor heights
| 2022-04-26 Gilbert Tract Carlos and I arrived around 9:30 PDT at the breach site to check the Side-Looker ADCP. It was breezy, sunny, and mostly clear. The water level was mid-low but it was difficult to tell which way the water was flowing because the breeze was producing a lot of ripples on the water I couldn’t connect to the SL at first. I disconnected the 5-pin pluggable block to cycle the sensor’s power. After reconnecting and waiting a few minutes, I was able to connect. The dashboard said the sensor was idle and not collecting data, but I downloaded data and data seemed complete for the last week (Joe and I were here last week). I restarted data collection. Since there was no live data to check yet, we went to service the tower before checking on it again. At the tower, Carlos cleaned flux and rad sensors. There was some cattail fluff on the sonic that Carlos cleaned off. The reservoir was 90% full; we refilled it. I downloaded met, cam, and USB GHG data. The camera only had a few photos on it. This has been a problem since early March. The camera connections in the datalogger all look ok. I cycled the power on the camera in case that would help. There were 2 new photos on the card when I left, so we’ll see next time. I don’t think it’s a card issue because the problem is consistent between cards, unless both cards have the same issue. I need to check the size/age of the cards. I couldn’t find my ethernet-USB dongle I use to connect to the 7550, so I couldn’t see live GHG data. However, there were the right number of files on the USB drive and the LED lights were blinking appropriately, so it should be ok. Both gamecams were gone; only the stakes remained. I pulled up the stakes and left them leaning against the tower. We weren’t getting a lot of good footage before, but it’s a bummer someone took the cameras. Probably won’t be putting cameras up anymore, unfortunately. Arable data has been intermittent here so Joe requested I check its power. It was plugged into a 12V line from the datalogger box, although the pins on the Arable connector are a bit corroded. The green LED was on so its built-in solar cell was giving it power. I reconnected the Arable power line. I measured the water sensor heights: eosGP dissolved CO2 sensor was 19cm below the water Campbell conductivity sensor was 27cm below the water Apogee CTD sensor was 20cm below the water We went back to the SL after about an hour at the tower to check on its live data. I couldn’t connect again despite another power cycle. Ari and I talked on Facetime to see what else we should try. It seems clear there’s some sort of connection issue, so we pulled the SL out of the water to check the connector at the sensor. Neither of us could get the (slimy) connector loose with our hands, so we decided it was tight enough. We pushed the sensor back into the water. I inspected the pluggable terminals a bit more. The 5-pin pluggable block was maybe, barely, slightly not pushed in all the way. I disconnected it and reconnected it, pushing it in as firmly as possible. I was then able to connect to the sensor! I couldn’t see any live data (since I just cycled its power), but the dashboard said it was collecting data so I left it as is. We left around 11:30 PDT. |
1 photos found
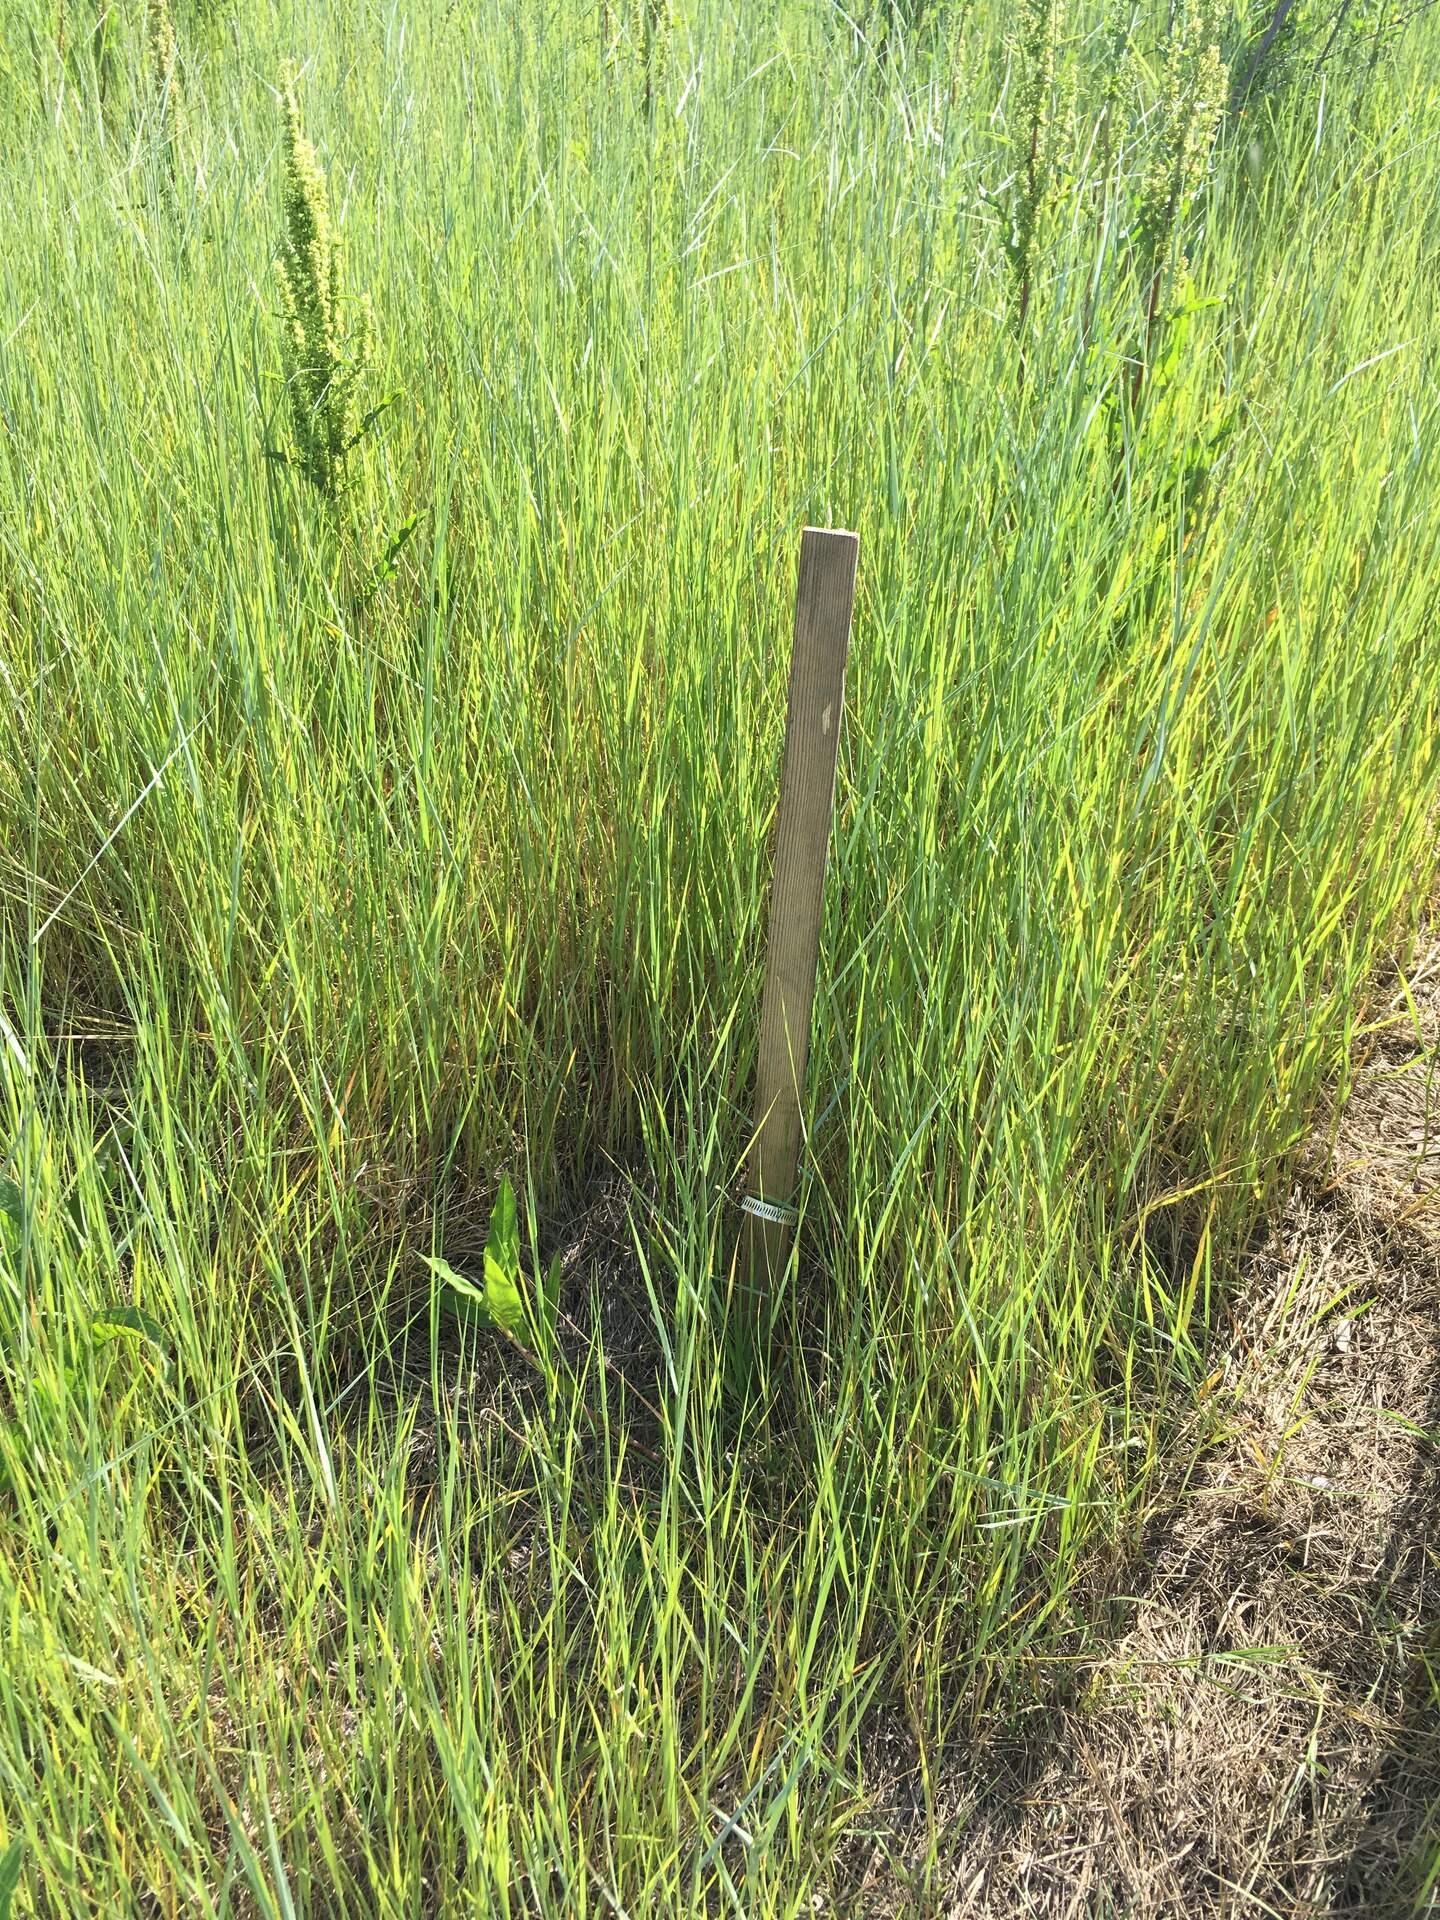
20200426GT_LonelyStake.jpg ( 2022-04-26 09:53:39 ) Full size: 1440x1920
Stake and hose clamp but no game camera...both game cameras were taken so no more otter videos.
8 sets found
Can't check MBWPEESWGT_mixed
Can't check MBEEWPSWEPGT_cam
16 GT_met graphs found
4 GT_flux graphs found
3 GT_adcp graphs found
1 GT_cam graphs found
2 GT_usgs graphs found
No data found for GT_chanexo.