
Field Notes
<--2021-08-11 10:50:00 | 2021-09-16 12:20:00-->Other sites visited today: Vaira
Phenocam link: Searching...
Tonzi: 2021-09-01 12:00:00 (DOY 244)
Author: Joe Verfaillie
Others:
Summary: Swapped 7500s, swapped FD chamber in open location, add power pack back to road well, z-cam cards in wrong cameras but okay, midday water potential
| Tonzi 2021-09-01 I arrived at about 12:00 PDT. It was clear sunny and warm with a nice cool breeze from the west. I could see the smoke plume from the Caldor fire near Tahoe on the horizon but I think the breeze kept the smoke away. There is still a little bit of water in the pond. The trees are looking brown again but about the right time of year for that. I swapped 7500s for calibration. At the tower sn 0035 came off and sn 75H-2514 went on. At the Floor sn 0418 came off and sn 75H-2669 went on. I uploaded the new config files, updated the pressure coefficients and reset the 7550 boxes. Tower 0035 read: 399.1ppm CO2, 458.8mmol/m3 H2O, 98.4kPa, 23.3C, 97.2SS Tower 2514 read: 409.0ppm CO2, 417.2mmol/m3 H2O, 98.3kPa, 22.9C, 102.0SS Floor 0418 read: 406.6ppm CO2, 482.2mmol/m3 H2O, 98.5kPa, 26.3C, 97.2SS Floor 2669 read: 409.4ppm CO2, 444.9mmol/m3 H2O, 98.5kPa, 26.3C, 101.1SS I collected flux, met and camera data. I measured the wells, soil moisture and DBH gauges. I did midday water potential. It’s getting hard to find twigs with all green leaves. Pressures are more negative and one tree maxed out the tank I have – probably last measurement for the year. I swapped the open FD chamber sn FD20180026 came off and sn FD20190027 went on. The existing chamber failed two performance checks with different concentration from the two samples. I put a lithium power pack back on the road well. All seemed well. I serviced the z-cams. The memory cards for cam 1 and cam 2 were swapped but seemed to work fine. I was careful to put them away correctly. The window on z-cam one has come loose. I put it back in place and it should be okay since it’s not likely to rain soon but needs to be re-glued. I left at about 15:30 PDT. |
Field Data
No tank data
Well Depth
| Date | Location | Depth (feet) |
|---|---|---|
| 2021-09-01 | VR_well | 60 |
| 2021-09-01 | VR_pond | 12.88 |
| 2021-09-01 | TZ_floor | 32 |
| 2021-09-01 | TZ_road | 39.7 |
| 2021-09-01 | TZ_tower | 36.7 |
mode = both
Moisture Point Probes TZ
Array
(
[0] => Tower_1
[1] => Soil_Transect_4_1
[2] => Soil_Transect_3_1
[3] => Soil_Transect_2_1
[4] => Soil_Transect_1_1
[5] => SoilCO2_West_A_1
[6] => SoilCO2_West_B_1
[7] => SoilCO2_West_C_1
[8] => Tower_2
[9] => Soil_Transect_4_2
[10] => Soil_Transect_3_2
[11] => Soil_Transect_2_2
[12] => Soil_Transect_1_2
[13] => SoilCO2_West_A_2
[14] => SoilCO2_West_B_2
[15] => SoilCO2_West_C_2
[16] => Tower_3
[17] => Soil_Transect_4_3
[18] => Soil_Transect_3_3
[19] => Soil_Transect_2_3
[20] => Soil_Transect_1_3
[21] => SoilCO2_West_A_3
[22] => SoilCO2_West_B_3
[23] => SoilCO2_West_C_3
[24] => Tower_4
[25] => Soil_Transect_4_4
[26] => Soil_Transect_3_4
[27] => Soil_Transect_2_4
[28] => Soil_Transect_1_4
[29] => SoilCO2_West_A_4
[30] => SoilCO2_West_B_4
[31] => SoilCO2_West_C_4
)
| Date | DOY | Rep | Depth | Tower_1 |
Soil_Transect_4_1 |
Soil_Transect_3_1 |
Soil_Transect_2_1 |
Soil_Transect_1_1 |
SoilCO2_West_A_1 |
SoilCO2_West_B_1 |
SoilCO2_West_C_1 |
Tower_2 |
Soil_Transect_4_2 |
Soil_Transect_3_2 |
Soil_Transect_2_2 |
Soil_Transect_1_2 |
SoilCO2_West_A_2 |
SoilCO2_West_B_2 |
SoilCO2_West_C_2 |
Tower_3 |
Soil_Transect_4_3 |
Soil_Transect_3_3 |
Soil_Transect_2_3 |
Soil_Transect_1_3 |
SoilCO2_West_A_3 |
SoilCO2_West_B_3 |
SoilCO2_West_C_3 |
Tower_4 |
Soil_Transect_4_4 |
Soil_Transect_3_4 |
Soil_Transect_2_4 |
Soil_Transect_1_4 |
SoilCO2_West_A_4 |
SoilCO2_West_B_4 |
SoilCO2_West_C_4 |
Avg | Spacial Count |
Measurement Count |
|---|---|---|---|---|---|---|---|---|---|---|---|---|---|---|---|---|---|---|---|---|---|---|---|---|---|---|---|---|---|---|---|---|---|---|---|---|---|---|
| 2021-09-01 | 244 | 0 | nan | 2.1 | 4.6 | 0.1 | 2.4 | 1.2 | 7.1 | 3 | 3.3 | 10.6 | 4.2 | 12.7 | 11.5 | 3.2 | 5.7 | 1.4 | 11.2 | 13.4 | 9.5 | 12.3 | 15.4 | 12.6 | 14.8 | 14 | 10.9 | 18.8 | 10.2 | 19.9 | 25.9 | 13 | 15.9 | 7.9 | 11.6 | |||
| 2021-09-01 | 244 | 1 | nan | 2.7 | 6.6 | 0.1 | 2.1 | 1.8 | 6.5 | 3.6 | 2.7 | 11.2 | 6.3 | 12.1 | 10.6 | 3.2 | 5.7 | 1.7 | 11.2 | 14 | 9.2 | 10.6 | 15.9 | 12.9 | 14.5 | 13.7 | 10.3 | 18.2 | 10.5 | 20.2 | 26.5 | 12.8 | 15.6 | 9.9 | 11.3 | |||
| 2021-09-01 | 244 | Avg | 0-15cm | 0 | 0 | |||||||||||||||||||||||||||||||||
| 2021-09-01 | 244 | Avg | 15-30cm | 0 | 0 | |||||||||||||||||||||||||||||||||
| 2021-09-01 | 244 | Avg | 30-45cm | 0 | 0 | |||||||||||||||||||||||||||||||||
| 2021-09-01 | 244 | Avg | 45-60cm | 0 | 0 |
mode = both
Moisture Point Probes VR
Array
(
[0] => Flux_Tower_1
[1] => Biomass_Cage_1
[2] => Flux_Tower_2
[3] => Biomass_Cage_2
[4] => Flux_Tower_3
[5] => Biomass_Cage_3
[6] => Flux_Tower_4
[7] => Biomass_Cage_4
)
| Date | DOY | Rep | Depth | Flux_Tower_1 |
Biomass_Cage_1 |
Flux_Tower_2 |
Biomass_Cage_2 |
Flux_Tower_3 |
Biomass_Cage_3 |
Flux_Tower_4 |
Biomass_Cage_4 |
Avg | Spacial Count |
Measurement Count |
|---|---|---|---|---|---|---|---|---|---|---|---|---|---|---|
| 2021-09-01 | 244 | 0 | nan | 0.1 | 1 | 6 | 3.2 | 3.4 | 12.3 | 11.9 | 15.3 | |||
| 2021-09-01 | 244 | 1 | nan | 0.1 | 0.4 | 5.4 | 3.2 | 2.8 | 10.9 | 11.3 | 15.3 | |||
| 2021-09-01 | 244 | Avg | 0-15cm | 0 | 0 | |||||||||
| 2021-09-01 | 244 | Avg | 15-30cm | 0 | 0 | |||||||||
| 2021-09-01 | 244 | Avg | 30-45cm | 0 | 0 | |||||||||
| 2021-09-01 | 244 | Avg | 45-60cm | 0 | 0 |
No TZ grass heigth found
No VR grass heigth found
Tree DBH
| Date | Tag# | Reading (mm) |
|---|---|---|
| 2021-09-01 | 1 | 12.7 |
| 2021-09-01 | 102 | 7.4 |
| 2021-09-01 | 2 | 11.3 |
| 2021-09-01 | 245 | 3.2 |
| 2021-09-01 | 3 | 17.1 |
| 2021-09-01 | 4 | 11.9 |
| 2021-09-01 | 5 | 7.5 |
| 2021-09-01 | 6 | 19.4 |
| 2021-09-01 | 7 | 6.2 |
| 2021-09-01 | 72 | 10.3 |
| 2021-09-01 | 79 | 11.5 |
Water Potential - mode: raw
| Time | Species | Tree | readings (bar) | ||
|---|---|---|---|---|---|
| 2021-09-01 13:25:00 | OAK | 251 | -59 | -57 | -55 |
| 2021-09-01 13:25:00 | OAK | 92 | -42 | -46 | -46 |
No TZ Grass Biomass data found
No TZ OakLeaves Biomass data found
No TZ PineNeedles Biomass data found
2 photos found
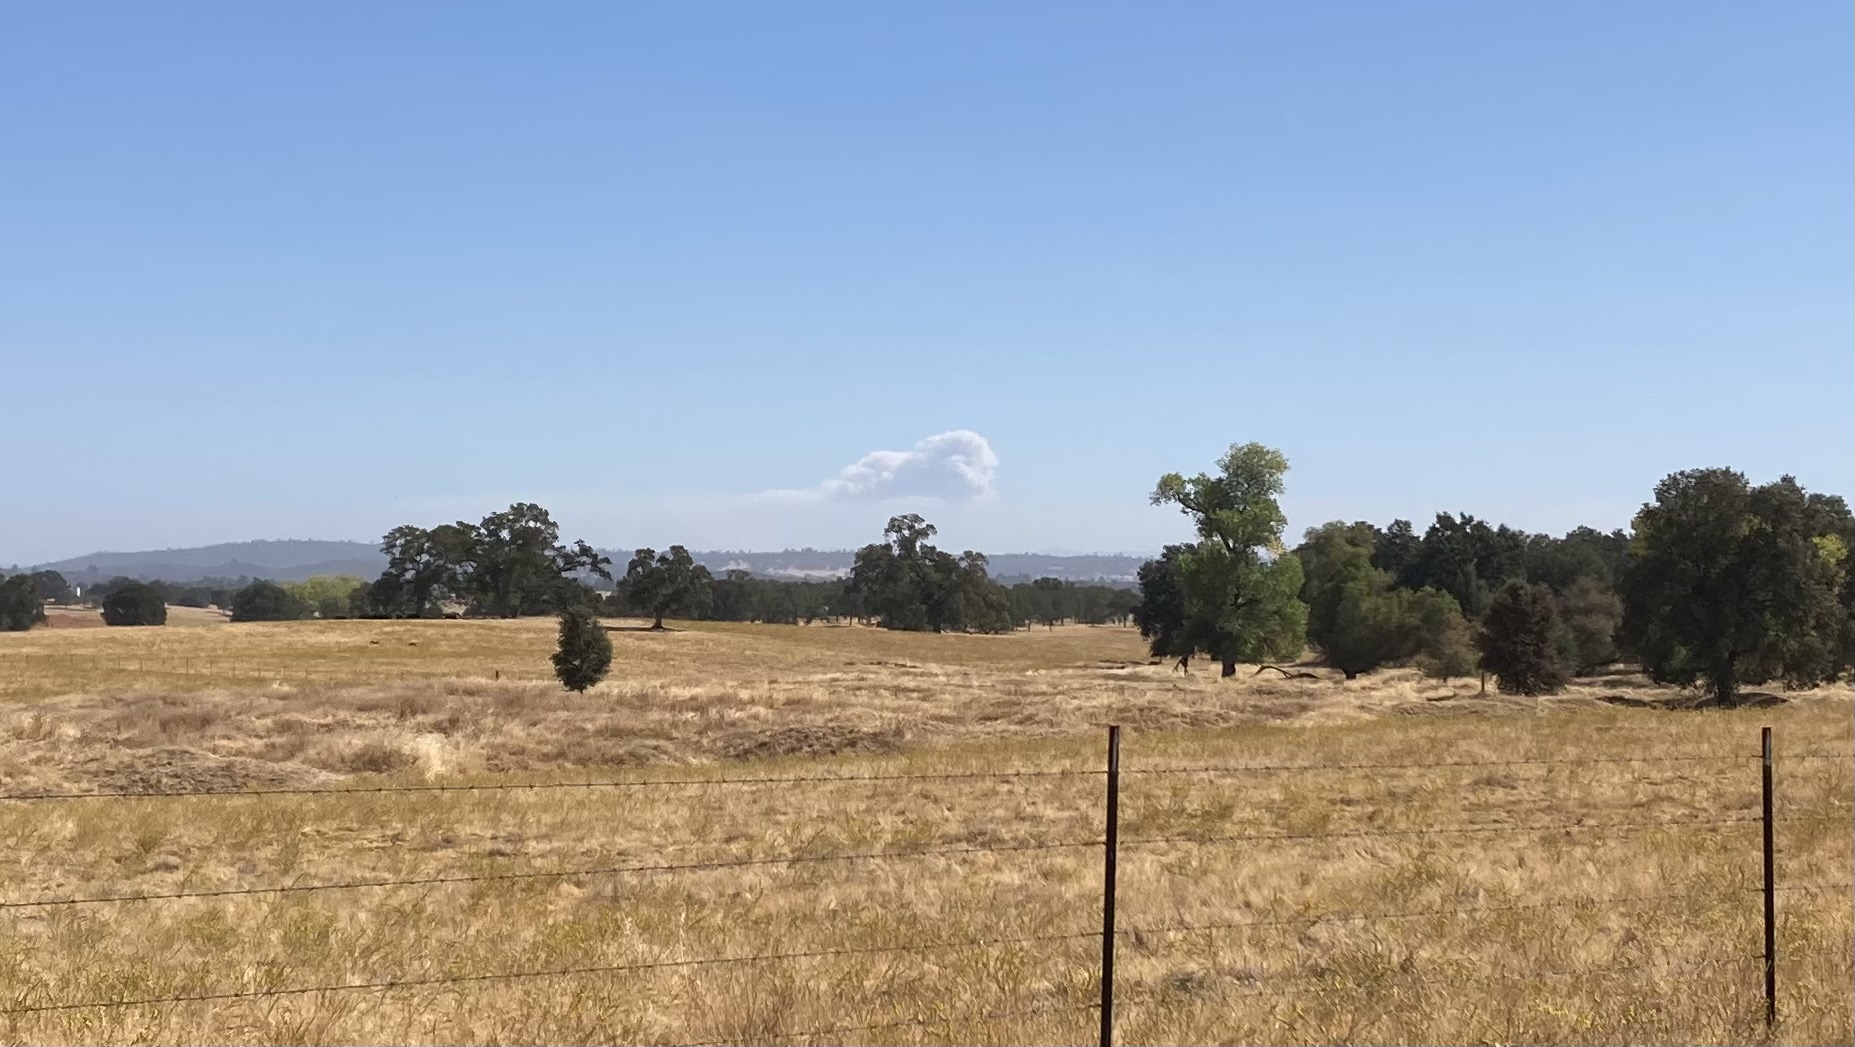
20210901TZ_CaldorFirePlume.jpg ( 2021-09-01 10:44:36 ) Full size: 1855x1047
Smoke plume from the Calder fire near Tahoe
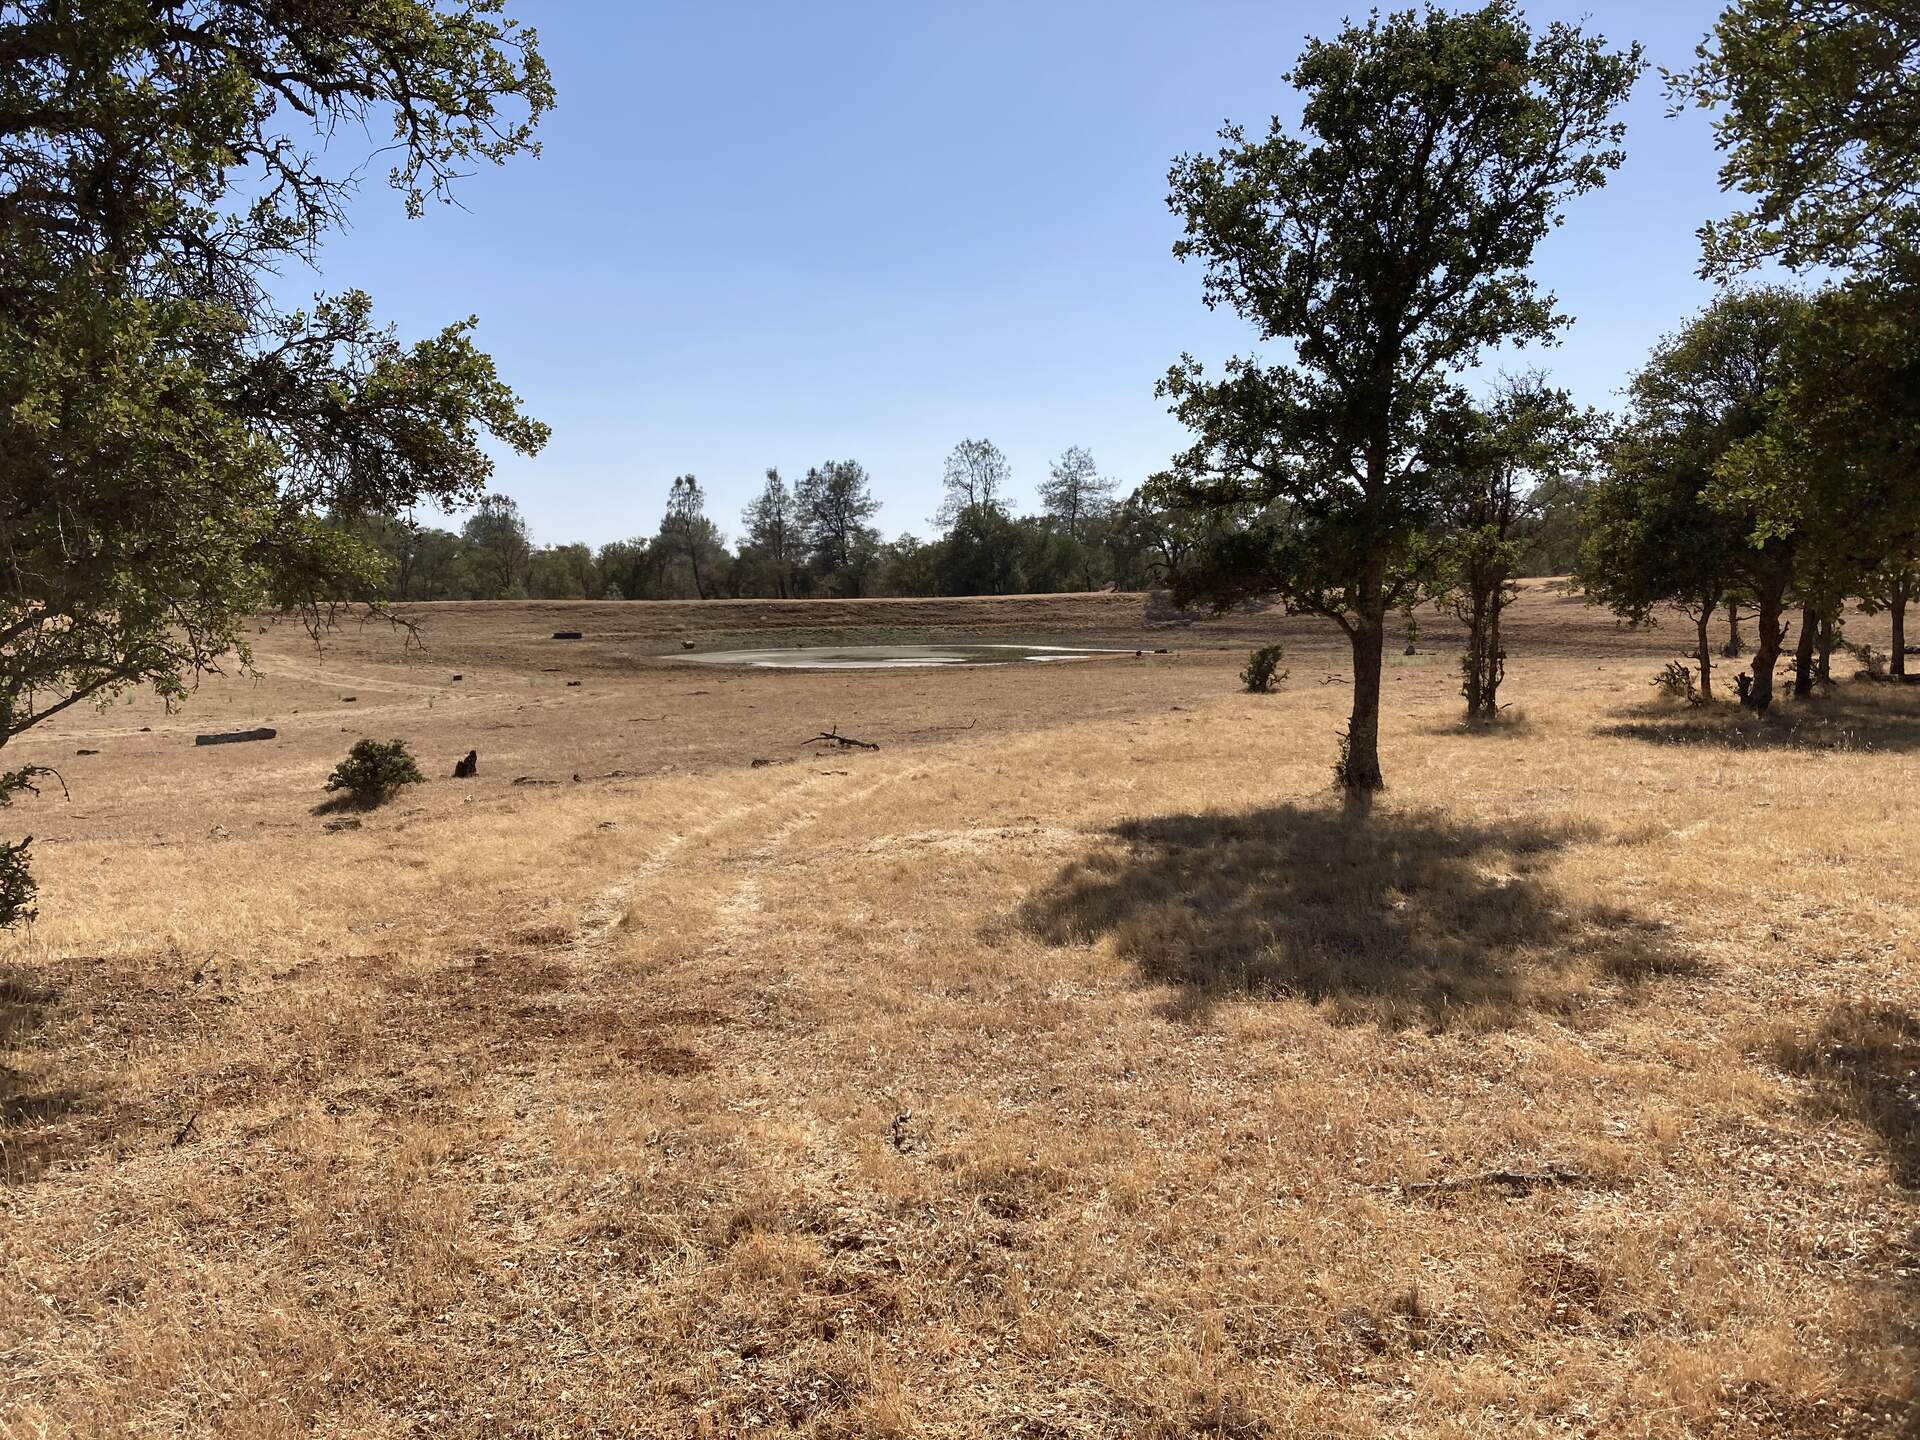
20210901TZ_Pond.jpg ( 2021-09-01 15:32:04 ) Full size: 1920x1440
The pond is almost dry
16 sets found
No data found for TZ_Fenergy.
11 TZ_tmet graphs found
11 TZ_soilco2 graphs found
Can't check TZ_mixed
3 TZ_mixed graphs found
1 TZ_fflux graphs found
8 TZ_fmet graphs found
No data found for TZ_tram.
3 TZ_co2prof graphs found
1 TZ_irt graphs found
No data found for TZ_windprof.
1 TZ_tflux graphs found
2 TZ_sm graphs found
Can't check TZ_met
1 TZ_met graphs found
Can't check TZVR_mixed
8 TZ_osu graphs found
3 TZ_fd graphs found
Tonzi Z-cam data