Field Notes
<--2021-07-13 11:50:00 | 2021-08-11 10:50:00-->Other sites visited today: Vaira
Phenocam link: Searching...
Tonzi: 2021-07-29 10:00:00 (DOY 210)
Author: Joe Verfaillie
Others:
Summary: Cleaned and sealed tower battery terminals, standard data collection, midday water potential, brown leaves on the trees, left most of the met data in the field
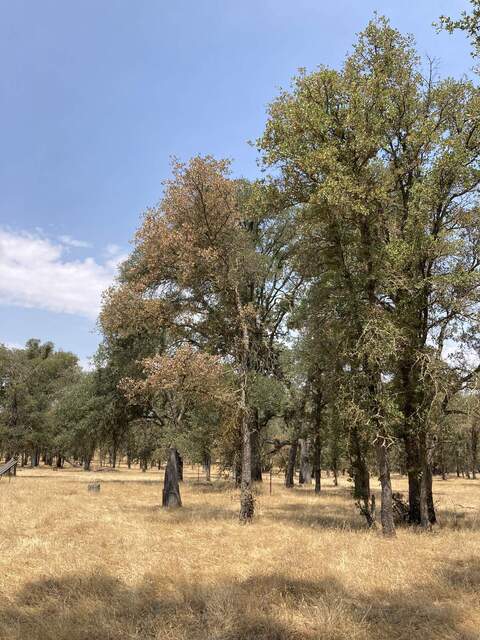
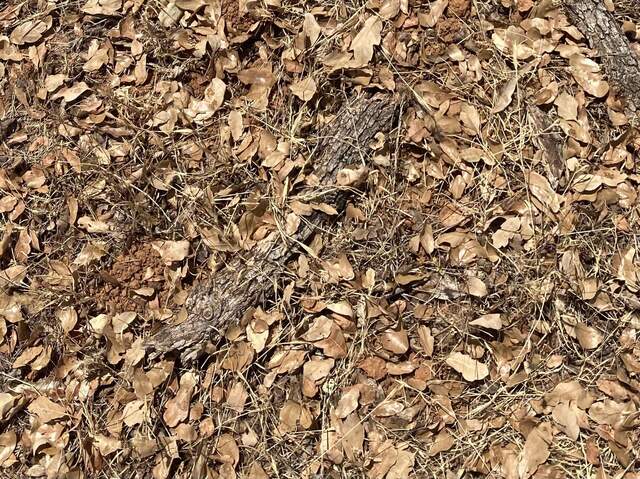
| Tonzi 2021-07-29 I arrived at about 10:00 PDT. It was clear sunny and hot with an occasional breeze from the west. Poor air quality was forecast for Sacramento due to smoke from the fires and I thought the sunlight had a slightly orange cast, but I couldn’t smell any smoke. Some of the trees had a lot of brown leaves and most of the trees had some brown leaves. There seemed to be a lot of fresh brown leaves on the ground in places. At the tower battery bank sn BB-TT I cleaned the battery terminals, replaced the affected battery cables and sealed all the connections. Power was down for a short time while I did the last pair of batteries. I collected data afterwards and everything seemed to have rebooted okay. All the Phenocam image had the correct date but I did not check the camera after the power outage – it’s probably okay after all it goes all night without power. I collected the flux data. The Tower 7500 read: 422.4ppm CO2, 556.4mmol/m3 H2O, 98.8kPa, 31.0C, 100.4SS The Floor 7500 read: 419.5ppm CO2, 572.6mmol/m3 H2O, 98.8kPa, 33.8C, 96.7SS I lowered the Tower eddy post to clean the 7500 windows. I measured the soil moisture and wells, read the dendrometers and serviced the zcams. I still need to reset the dendrometer on tree 7 – bring a new screw and WD-40 next time. I did the midday water potential measurements. The measurements started out much like I expected being about 5bar higher than last time. But then I got some 5 to 10bars less than last time too. I’m wondering if the trees are stopping supplying water to some of their leaves, pressures are reducing and leaves are turning brown. I collected and cleared the FD data and then did a performance check on FD chamber sn FD20180048 under the tree. The chamber was unfastened and set on its side. It checked out okay and its concentrations were reset to 400ppm. I managed to leave the USB stick with most of the met data plugged into the Tower computer – so no met data until next visit. I left at about 13:45 |
Field Data
No tank data
Well Depth
| Date | Location | Depth (feet) |
|---|---|---|
| 2021-07-29 | VR_well | 59 |
| 2021-07-29 | TZ_floor | 31.7 |
| 2021-07-29 | TZ_road | 39.4 |
| 2021-07-29 | TZ_tower | 36.25 |
mode = both
Moisture Point Probes TZ
Array
(
[0] => Tower_1
[1] => Soil_Transect_3_1
[2] => Soil_Transect_2_1
[3] => Soil_Transect_1_1
[4] => SoilCO2_West_A_1
[5] => SoilCO2_West_B_1
[6] => SoilCO2_West_C_1
[7] => Tower_2
[8] => Soil_Transect_3_2
[9] => Soil_Transect_2_2
[10] => Soil_Transect_1_2
[11] => SoilCO2_West_A_2
[12] => SoilCO2_West_B_2
[13] => SoilCO2_West_C_2
[14] => Tower_3
[15] => Soil_Transect_4_3
[16] => Soil_Transect_3_3
[17] => Soil_Transect_2_3
[18] => Soil_Transect_1_3
[19] => SoilCO2_West_A_3
[20] => SoilCO2_West_B_3
[21] => SoilCO2_West_C_3
[22] => Tower_4
[23] => Soil_Transect_4_4
[24] => Soil_Transect_3_4
[25] => Soil_Transect_2_4
[26] => Soil_Transect_1_4
[27] => SoilCO2_West_A_4
[28] => SoilCO2_West_B_4
[29] => SoilCO2_West_C_4
[30] => Soil_Transect_4_1
[31] => Soil_Transect_4_2
)
| Date | DOY | Rep | Depth | Tower_1 |
Soil_Transect_3_1 |
Soil_Transect_2_1 |
Soil_Transect_1_1 |
SoilCO2_West_A_1 |
SoilCO2_West_B_1 |
SoilCO2_West_C_1 |
Tower_2 |
Soil_Transect_3_2 |
Soil_Transect_2_2 |
Soil_Transect_1_2 |
SoilCO2_West_A_2 |
SoilCO2_West_B_2 |
SoilCO2_West_C_2 |
Tower_3 |
Soil_Transect_4_3 |
Soil_Transect_3_3 |
Soil_Transect_2_3 |
Soil_Transect_1_3 |
SoilCO2_West_A_3 |
SoilCO2_West_B_3 |
SoilCO2_West_C_3 |
Tower_4 |
Soil_Transect_4_4 |
Soil_Transect_3_4 |
Soil_Transect_2_4 |
Soil_Transect_1_4 |
SoilCO2_West_A_4 |
SoilCO2_West_B_4 |
SoilCO2_West_C_4 |
Soil_Transect_4_1 |
Soil_Transect_4_2 |
Avg | Spacial Count |
Measurement Count |
|---|---|---|---|---|---|---|---|---|---|---|---|---|---|---|---|---|---|---|---|---|---|---|---|---|---|---|---|---|---|---|---|---|---|---|---|---|---|---|
| 2021-07-29 | 210 | 0 | nan | 3.3 | 0.6 | 3 | 3 | 8.3 | 3 | 3 | 11.5 | 12.7 | 11.5 | 4.2 | 5.7 | 1.7 | 10.9 | 14 | 9.2 | 11.7 | 16.2 | 13.4 | 14.3 | 14.8 | 10.9 | 19.6 | 10.7 | 21.6 | 27.6 | 13.3 | 17 | 8.2 | 12.5 | |||||
| 2021-07-29 | 210 | 1 | nan | 3.9 | 0.6 | 4.5 | 3 | 7.4 | 2.7 | 2.7 | 10.6 | 12.1 | 11.8 | 4.2 | 6.3 | 1.7 | 11.2 | 14.3 | 9.8 | 11.7 | 15.9 | 12.9 | 14.8 | 14.8 | 10.9 | 19.1 | 10.5 | 21.6 | 28.2 | 13.9 | 17.6 | 8.2 | 12.5 | 2.2 | 4.5 | |||
| 2021-07-29 | 210 | 2 | nan | 9.8 | 11 | 0.7 | 5.1 | |||||||||||||||||||||||||||||||
| 2021-07-29 | 210 | Avg | 0-15cm | 0 | 0 | |||||||||||||||||||||||||||||||||
| 2021-07-29 | 210 | Avg | 15-30cm | 0 | 0 | |||||||||||||||||||||||||||||||||
| 2021-07-29 | 210 | Avg | 30-45cm | 0 | 0 | |||||||||||||||||||||||||||||||||
| 2021-07-29 | 210 | Avg | 45-60cm | 0 | 0 |
mode = both
Moisture Point Probes VR
Array
(
[0] => Flux_Tower_1
[1] => Biomass_Cage_1
[2] => Flux_Tower_2
[3] => Biomass_Cage_2
[4] => Flux_Tower_3
[5] => Biomass_Cage_3
[6] => Flux_Tower_4
[7] => Biomass_Cage_4
)
| Date | DOY | Rep | Depth | Flux_Tower_1 |
Biomass_Cage_1 |
Flux_Tower_2 |
Biomass_Cage_2 |
Flux_Tower_3 |
Biomass_Cage_3 |
Flux_Tower_4 |
Biomass_Cage_4 |
Avg | Spacial Count |
Measurement Count |
|---|---|---|---|---|---|---|---|---|---|---|---|---|---|---|
| 2021-07-29 | 210 | 0 | nan | 0.1 | 0.4 | 6.3 | 2.9 | 3.1 | 11.7 | 11.6 | 15.9 | |||
| 2021-07-29 | 210 | 1 | nan | 1.6 | 0.1 | 6.3 | 2.6 | 3.9 | 12 | 11.3 | 15.9 | |||
| 2021-07-29 | 210 | Avg | 0-15cm | 0 | 0 | |||||||||
| 2021-07-29 | 210 | Avg | 15-30cm | 0 | 0 | |||||||||
| 2021-07-29 | 210 | Avg | 30-45cm | 0 | 0 | |||||||||
| 2021-07-29 | 210 | Avg | 45-60cm | 0 | 0 |
No TZ grass heigth found
No VR grass heigth found
Tree DBH
| Date | Tag# | Reading (mm) |
|---|---|---|
| 2021-07-29 | 1 | 12.9 |
| 2021-07-29 | 102 | 7.9 |
| 2021-07-29 | 2 | 11.2 |
| 2021-07-29 | 245 | 3.5 |
| 2021-07-29 | 3 | 17.2 |
| 2021-07-29 | 4 | 11.9 |
| 2021-07-29 | 5 | 7.6 |
| 2021-07-29 | 6 | 19.4 |
| 2021-07-29 | 7 | 23.8 |
| 2021-07-29 | 72 | 11.5 |
| 2021-07-29 | 79 | 11.6 |
Water Potential - mode: raw
| Time | Species | Tree | readings (bar) | |||
|---|---|---|---|---|---|---|
| 2021-07-29 12:40:00 | OAK | 102 | -45 | -46 | -33 | -34 |
| 2021-07-29 12:40:00 | OAK | 92 | -28 | -42 | -31 | -39 |
No TZ Grass Biomass data found
No TZ OakLeaves Biomass data found
No TZ PineNeedles Biomass data found
2 photos found

20210729TZ_BrownLeaves.jpg ( 2021-07-29 11:57:31 ) Full size: 1440x1920
Some trees have many brown leaves most trees have some brown leaves

20210729TZ_LeavesOnTheGround.jpg ( 2021-07-29 13:30:01 ) Full size: 1920x1436
Some places a lot of fresh looking leaves on the ground
16 sets found
No data found for TZ_Fenergy.
11 TZ_tmet graphs found
11 TZ_soilco2 graphs found
Can't check TZ_mixed
3 TZ_mixed graphs found
1 TZ_fflux graphs found
8 TZ_fmet graphs found
No data found for TZ_tram.
3 TZ_co2prof graphs found
1 TZ_irt graphs found
No data found for TZ_windprof.
1 TZ_tflux graphs found
2 TZ_sm graphs found
Can't check TZ_met
1 TZ_met graphs found
Can't check TZVR_mixed
8 TZ_osu graphs found
3 TZ_fd graphs found
Tonzi Z-cam data

