Field Notes
<--2021-03-16 14:50:00 | 2021-04-15 15:00:00-->Other sites visited today: Hill Slough | Bouldin Corn | Bouldin Alfalfa | West Pond
Phenocam link: Searching...
East End: 2021-03-30 15:30:00 (DOY 89)
Author: Daphne Szutu
Others:
Summary: Regular data collection/cleaning, windy day, reinstalled Apogee NDVI sensors, installed 3 undercanopy PAR sensors, uploaded new CR1000 program
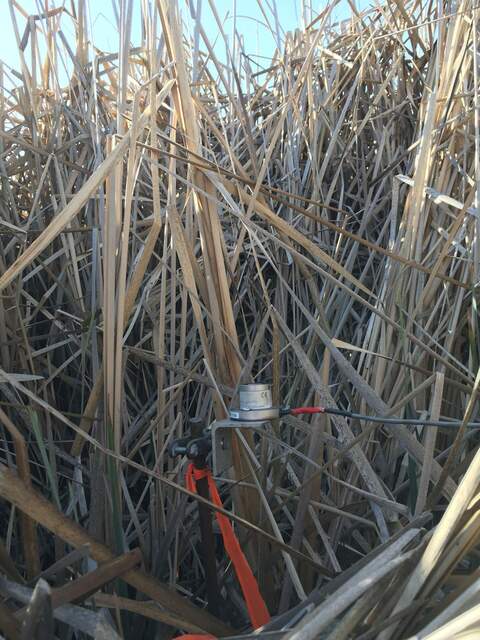
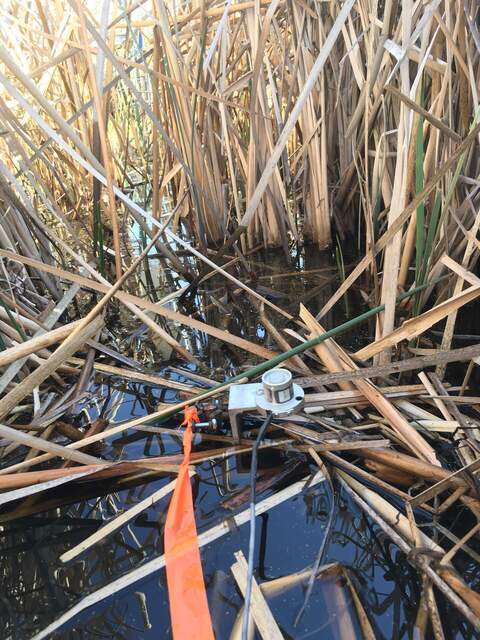
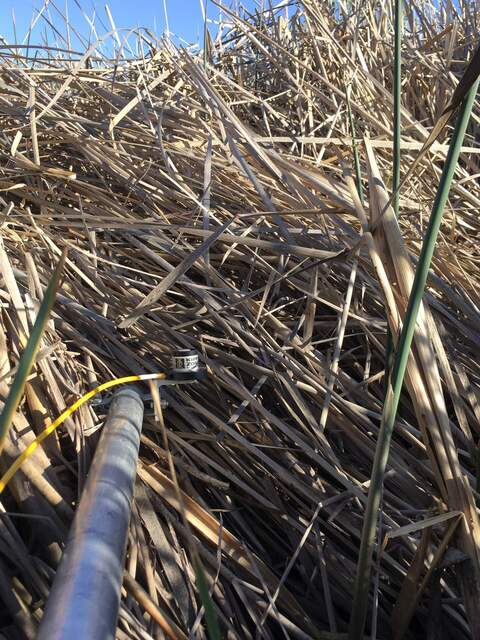
| 2021-03-30 East End I arrived at 15:30 PDT. It was windy, sunny, and warm. A few more reeds are coming up but the wetland is still mostly brown. The staff gauge read 42 cm. I downloaded met, camera, USB GHG, and miniDOT data; cleaned met and rad sensors; and changed the miniDOT and water level sensor desiccants. I refilled the wash reservoir, which was empty because of the leaking in-line filter. I added Apogee NDVI sensors back after repairing a corroded splice on one of them. Sn 1053 is measuring incoming radiation and sn 1054 is measuring reflected radiation. I added 3 PAR sensors in the wetland to measure undercanopy PAR. I uploaded a new CR1000 program adding the 3 PAR sensors to the end of the mux and removing the eosGP data columns that are no longer used. PAR_under_1: sn 140455, SE of the tower mounted on a horizontal boom. The sensor is sitting on top of a fallen bundle of dried reeds. PAR_under_2: sn 990025, S of the tower mounted on a grounding rod. The sensor is sitting in an open patch a few cm above the water surface. Later I tried to move the sensor up about 10cm in case the water level rose, but I couldn’t pull the grounding rod easily up and I didn’t want to disturb the area too much. PAR_under_3: sn 990031, S of the tower mounted on a grounding rod. The sensor is sitting in a heterogeneous patch of dried reeds about 30cm above the water level. The litter layer ranged from about 20cm tall to maybe about 1m tall. LI-7500 readings: CO2 409ppm H2O 213ppm T 26.1C P 101.5kPa SS 104 --> 106 after cleaning LI7700 readings: CH4 2.0 after cleaning RSSI 33 --> 79 after cleaning I left at 17:40 PDT. |
3 photos found

20210330EE_ParUnder3.jpg ( 2021-03-30 17:10:41 ) Full size: 1440x1920
Undercanopy PAR sensor #3 in a heterogeneous litter layer. This sensor is about 30cm above the water level

20210330EE_ParUnder2.jpg ( 2021-03-30 17:10:11 ) Full size: 1440x1920
Undercanopy PAR sensor #2 in an open water location a few cm above the water

20210330EE_ParUnder1.jpg ( 2021-03-30 17:14:58 ) Full size: 1440x1920
Undercanopy PAR sensor #1 above a patch of blown-down reeds
11 sets found
14 EE_met graphs found
Can't check EE_mixed
1 EE_mixed graphs found
8 EE_flux graphs found
Can't check MBWPEESWGT_mixed
1 EE_cam graphs found
Can't check MBEEWPSWEPGT_cam
Can't check SIMBTWEE_met
Can't check EE_Temp
5 EE_Temp graphs found
Can't check EE_minidot
1 EE_minidot graphs found
Can't check MBSWEEWPBCBA
1 EE_processed graphs found

