Field Notes

<--2020-12-16 13:55:00 | 2021-01-17 14:55:00-->
Other sites visited today: Mayberry | Sherman Wetland | East End | West Pond | Bouldin Alfalfa
Phenocam link: Searching...

Bouldin Corn: 2021-01-03 13:55:00 (DOY 3)
Author: Daphne Szutu
Others: Mike

Summary: Regular data collection/cleaning, changed HMP fan, hunters at the club

2021-01-03
Bouldin Corn

Mike and I arrived at 13:55 PST. It was calm, cool, and partly overcast. 2 trucks were parked outside the duck club. We could hear many geese honking and hunting sounds. Tyler had put a PVC stake in the mud sinkhole between our tower and his datalogger enclosure.

I downloaded met, camera, and USB GHG data. I downloaded and cleared the FD chamber. I downloaded the PA data and restarted the sensor. The reservoir was 90% full; I topped it off.

The HMP fan had died so I replace it (24V fan).

LI-7500 readings:
CO2 436ppm
H2O 540ppm
T 12.9C
P 101.6kPa
SS 100-->103 after cleaning
LI7700 readings:
CH4 2.1 after cleaning
RSSI 60-->82 after cleaning

We left at 14:25 PST.

1 photos found

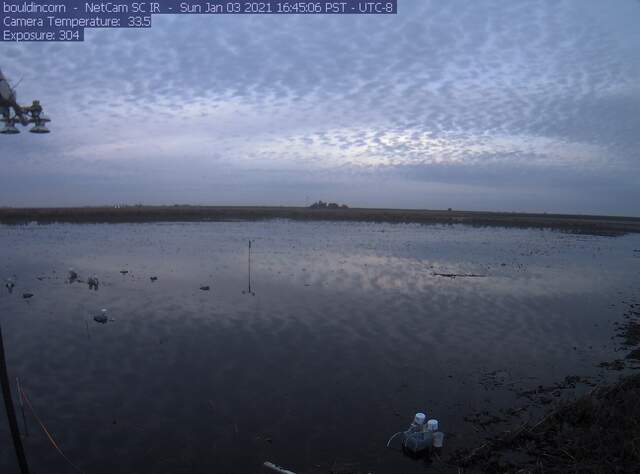
Ripple-like clouds reflected in flooded field
bouldincorn_2021_01_03_164506.jpg ( 2021-01-03 16:46:04 ) Full size: 1296x960
Ripple-like clouds reflected in flooded field

Graphs display:
6 sets found

17 BC_met graphs found

Explore the graph:Battery Voltage in a new window

Explore the graph:Soil Heat Flux in a new window

Explore the graph:Temperature in a new window

Explore the graph:Solar Radiation in a new window

Explore the graph:Air Pressure and RH in a new window

Explore the graph:Soil Moisture in a new window

Explore the graph:Bouldin Corn PAR in a new window

Explore the graph:NDVI channels in a new window

Explore the graph:PRI Channels in a new window

Explore the graph:Soil Temperatures Set A in a new window

Explore the graph:Soil Temperatures Set B in a new window

Explore the graph:Soil Temperatures Set C in a new window

Explore the graph:SRS NDVI and PRI in a new window

Explore the graph:Surface Temperature in a new window

Explore the graph:Forced Diffusion CO2 in a new window

Explore the graph:Forced Diffusion Soil CO2 Flux in a new window

Explore the graph:Surface Temperature in a new window

5 BC_flux graphs found

Explore the graph:LI-7500 CO2 and H2O in a new window

Explore the graph:7700 CH4 and RSSI in a new window

Explore the graph:Wind in a new window

Explore the graph:Counts in a new window

Explore the graph:CO2 in ppm in a new window

Can't check TATWBABCSB_cam
Can't check MBSWEEWPBCBA
2 BC_pa graphs found

Explore the graph:Purple Air Met Data in a new window

Explore the graph:Purple Air Particulate Matter in a new window

1 BC_arable graphs found

Explore the graph:Temperatures in a new window