Field Notes
<--2020-09-09 09:00:00 | 2020-10-05 14:30:00-->Other sites visited today: Sherman Wetland | East End | West Pond | Bouldin Corn | Bouldin Alfalfa
Phenocam link: Searching...
Mayberry: 2020-09-10 10:35:00 (DOY 254)
Author: Joe Verfaillie
Others: Daphne
Summary: Water level very high, reinstalled fluorometer, raised FD chamber, Solano Land Trust on site spraying herbicide on pepper weed.
| Mayberry 2020-09-10 Daphne and I arrived at 10:35 PDT. It was cool and overcast with the sun an orange disk in the sky. I could not smell any smoke in the air. Nearby AQI stations were reporting 100-130 AQI. The water level was 87cm – uncommonly high. There were number of vehicles at the edge of the wetland in the alfalfa field to the east. It looked like the Solano Land Trust who are working on some kind of native plant project and trying to remove invasive species. They are currently mowing and spraying herbicide on the pepper weed. Pepper weed near the tower looked wilted and had chemical green spots where it had been sprayed. Daphne collected water samples for Isabel at 9:45 PST, collected the data and swapped the water level desiccant. The 7500 read: 421ppm CO2, 789mmol/m3 H2O, 18.6C, 101.5kPa, 97SS – 101 after cleaning The 7700 read: 2.06ppm CH4, 38RSSI – 82 after cleaning. The leading edges were dark with gunk. The wash reservoir was 2/3 full – refilled. The radiometers had some ash on them. I forgot to check and clean the net radiometer over the water. The filters on the FD chamber were above the water when we arrive but the boom was being held slightly higher by a shortened guywire. I adjusted the bolts to raise the chamber by about 5cm but still had to tie off the guywire to keep the filters above the water. Hopefully when the water level returns to a more normal level we can let the boom float again. We downloaded and cleared the FD data. I also reinstalled the fluorometer sn 2300565 after Daphne did a thorough cleaning in the lab. The battery bank here are AGM batteries and don’t need maintenance. We washed the solar panels that the otters have been using as a jungle gym. We left at 11:10 PDT. |
2 photos found

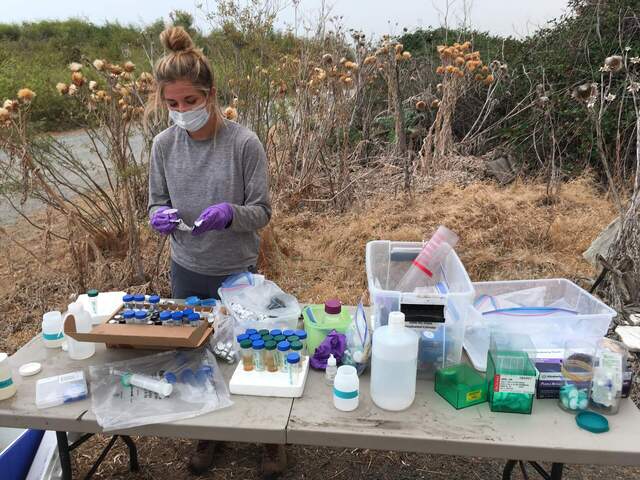
20200909MB_OutdoorLab.jpg ( 2020-09-09 00:00:00 ) Full size: 1920x1440
Erin processing water samples (filter, filter and filter again)

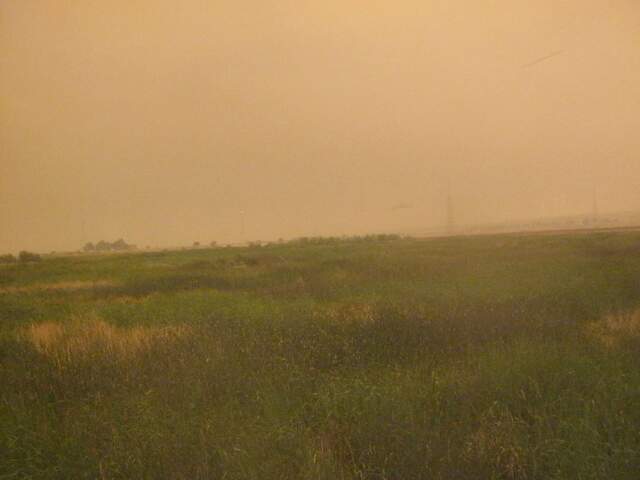
MB_autocam_20200909_0745.jpg ( 2020-09-09 07:45:02 ) Full size: 1920x1440
Orange skies from wildfire smoke
11 sets found
7 MB_flux graphs found
No data found for MB_met.
28 MB_tule graphs found
Can't check MBWPEESWGT_mixed
1 MB_cam graphs found
Can't check MBEEWPSWEPGT_cam
Can't check SIMBTWEE_met
1 MB_minidot graphs found
Can't check MBSWEEWPBCBA
1 MB_processed graphs found
Can't check MB_fd
1 MB_fd graphs found

