
Field Notes
<--2020-08-21 12:30:00 | 2020-09-10 14:25:00-->Other sites visited today: Tonzi | East End | West Pond | Bouldin Alfalfa
Phenocam link: Searching...
Bouldin Corn: 2020-09-01 08:45:00 (DOY 245)
Author: Daphne Szutu
Others: Joe
Summary: Regular data collection/cleaning, hazy sky, harvesting soon, moved tower/sensors back away from field, reinstalled field sensors under tower, dug new well, removed 1 FD chamber that wouldn't turn on, final clip plot of the year
| 2020-09-01 Bouldin Corn Joe and I arrived around 8:45 PDT. It was a breezy and hazy day with occasional gusts of wind. The sunlight looked reddish the whole day, although I didn’t smell any smoke. The corn looked ready to harvest—dry, yellow and brittle. Corn harvest has started on the north side of Hwy 12, so Tyler moved his chambers back yesterday. Joe removed the soil sensors and 2-Arable post from the field and I cleared some weeds behind the tower. Joe removed the well PVC pipe and shooed away two black widow spiders. To make the tower easier to move, we folded in the radiation boom, removed the boardwalks, and used bungee cords to secure the scaffolding feet to the frame. The two of us moved the tower back about 3-4m, clearing some more weeds along the way. Joe reinstalled the 2-Arable post facing to the west by Tyler’s blue box, put in fence posts to secure the tower, cleared the weeds under the tower, and dug a new well as far back from the tower as the sensor cable would reach. He headed out around 10:30 PDT to Tonzi. I reinstalled the three sets of thermocouples, soil heat flux plates, and VWC sensors under the tower as well as the Theta soil moisture sensor. The soil heat flux plates and VWC sensors were all 2-5cm below the surface. The Theta probe was installed vertically so the tines were underground and the sensor body was above ground. I also reinstalled the three eosFD chambers under the tower, although I later removed sn FD20180047 because it was not turning on, even after I swapped cables. It was not a particularly hot day, although maybe it did warm up from sitting in the sun. Sensors moved: Theta probe sn M003370 VWC CS655 sn 17133, sn 17128, sn 17129 Water level sn 70011234 SHF sn 11326, sn 10867, sn 10861 eosFD sn FD20180047, sn FD20180048, sn FD20180067 Well measurements: Top of pipe to ground = 58 cm Top of pipe to sensor = 127 cm Well depth ~ 160 cm (dry at bottom) I downloaded met, cam, and USB GHG data. There was no PA data on the microSD card. I restarted the unit and saw promising lights, so I left it as is for now since the unit collected data on the lab bench fine. I cleaned flux and rad sensors. I downloaded and cleared the two FD chambers that did start up. The wash reservoir was full. I updated the CR1000 program to add in the zPAR columns again. Since we will probably use these columns next year, I decided to leave them in for now rather than removing them now and adding them again next spring. I took 5 clip plot samples for biomass measurements, the last sample before they harvest. We need to check the sonic orientation next time. LI-7500 readings: CO2 409ppm H2O 655ppm T 25.1C P 100.6kPa SS 101-->102 after cleaning LI7700 readings: CH4 1.97ppm RSSI 38-->84 after cleaning I left at 13:40 PDT. |
Veg Height (cm): Tape measure from ground to top of plant
251, 246, 228, 188, 236, 201, 203, 210, 230, 220, 234, 226, avg = 222.8, stdev = 19
1 photos found
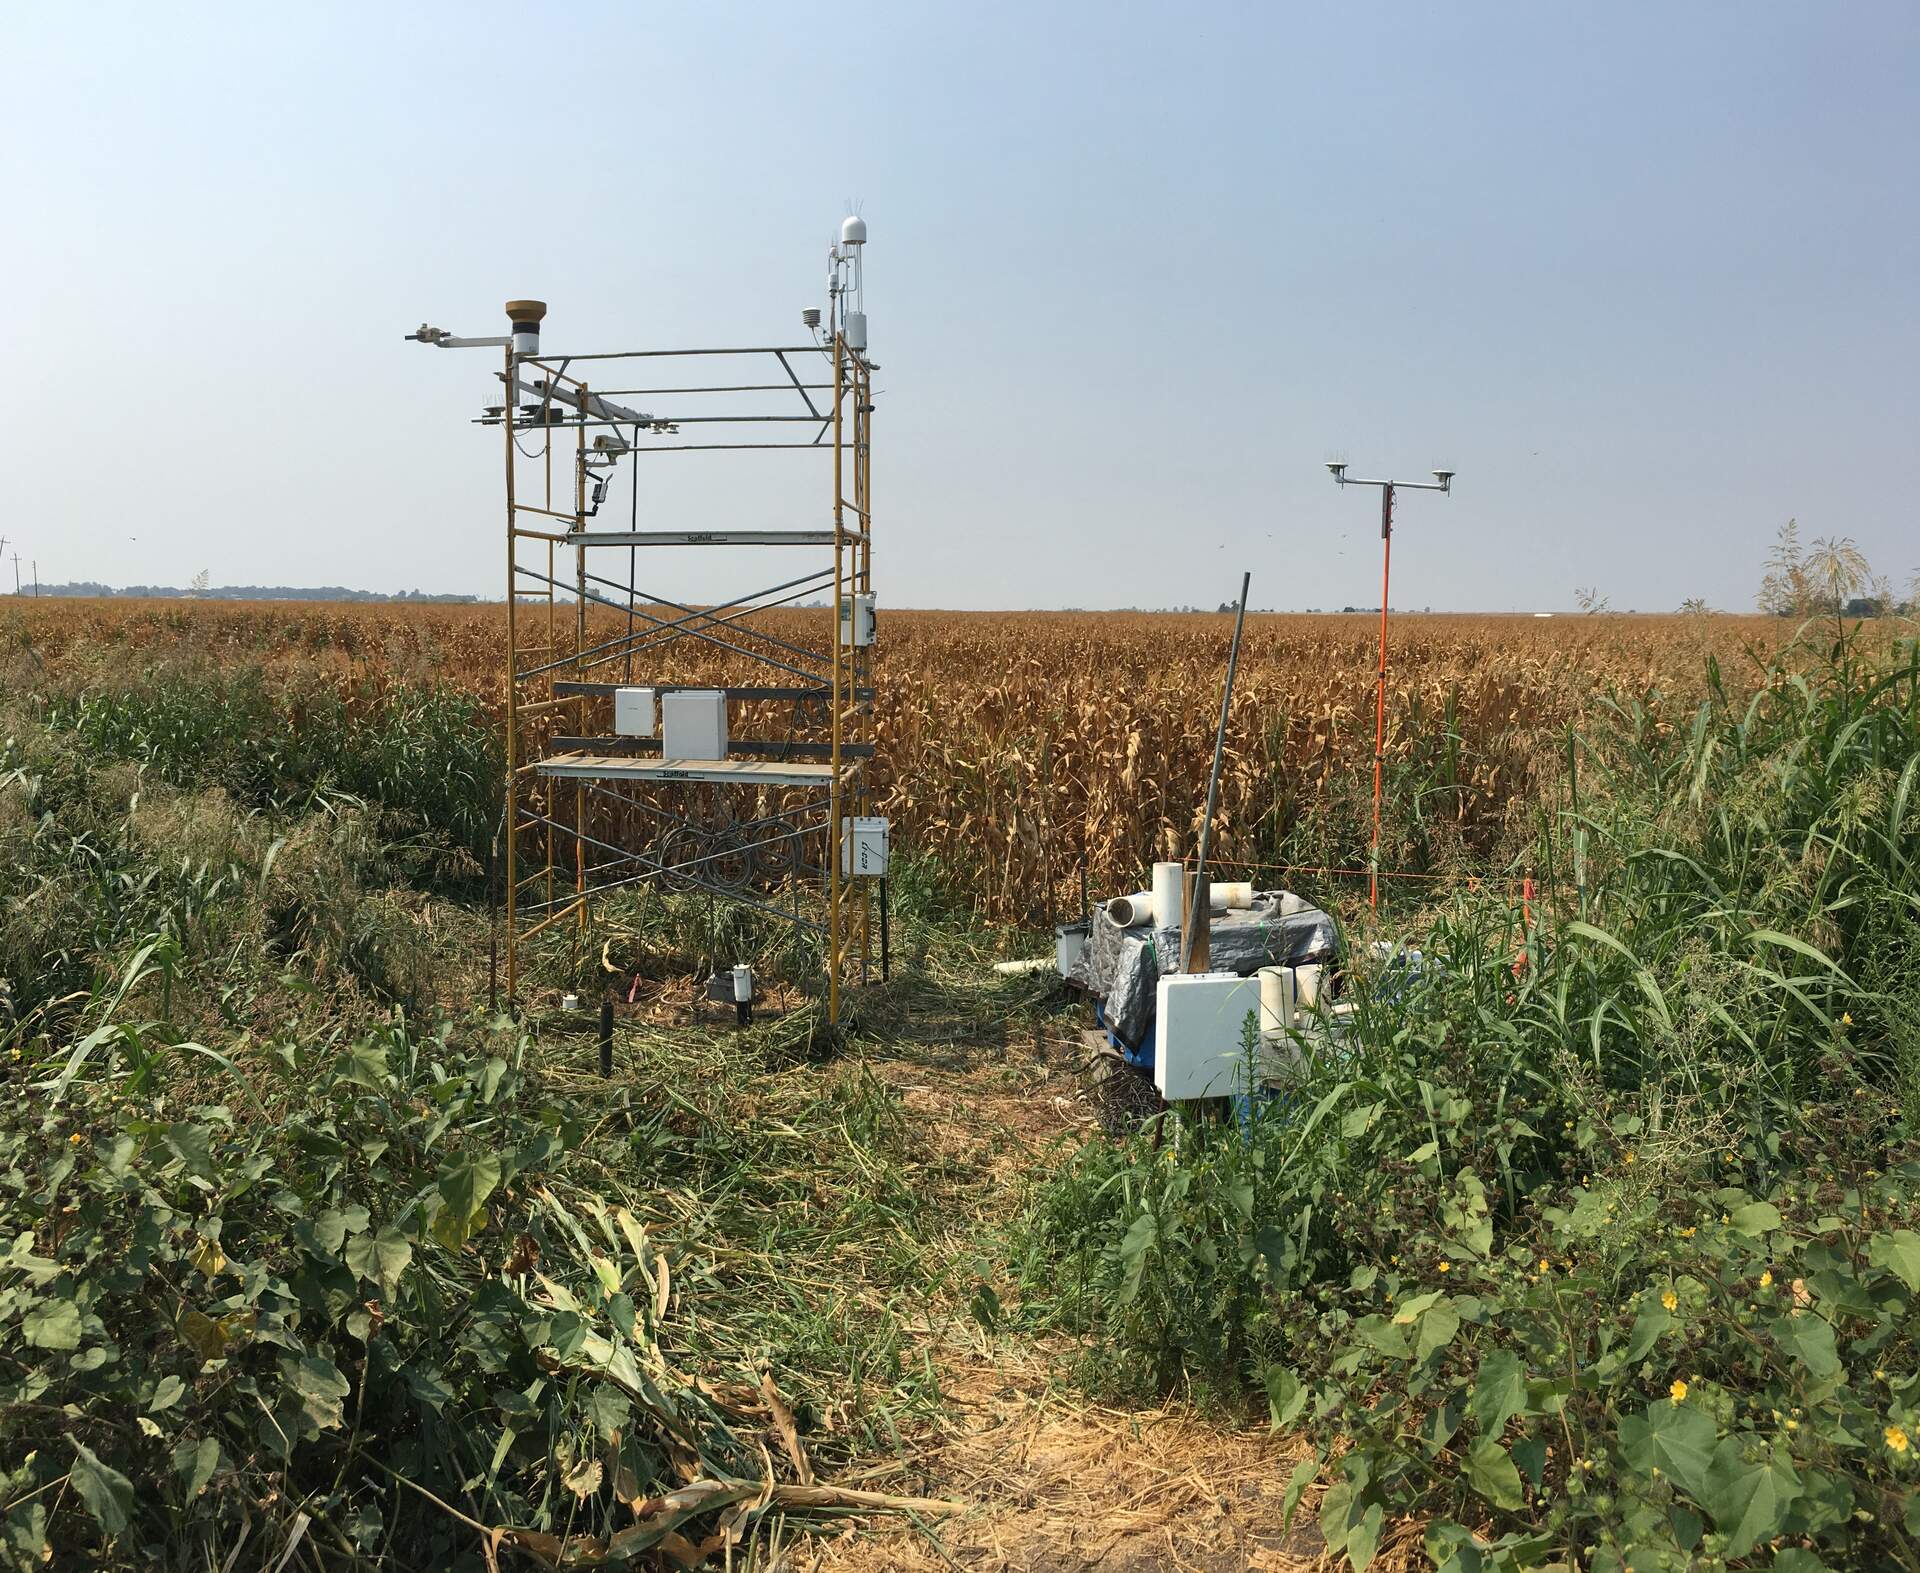
20200901BC_TowerMove.jpg ( 2020-09-01 13:37:48 ) Full size: 1920x1573
Moved the tower back 3-4m before harvest. It's getting crowded underneath the tower with all the soil sensors and forced diffusion chambers.
6 sets found
17 BC_met graphs found
5 BC_flux graphs found
Can't check TATWBABCSB_cam
Can't check MBSWEEWPBCBA
No data found for BC_pa.
1 BC_arable graphs found