
Field Notes
<--2020-07-24 11:30:00 | 2020-08-11 08:50:00-->Other sites visited today: Bouldin Corn | Mayberry
Phenocam link: Searching...
Sherman Wetland: 2020-07-30 09:15:00 (DOY 212)
Author: Daphne Szutu
Others:
Summary: Permanent tower: Regular data collection/cleaning, windy day, plugged in ethernet switch, replaced precip funnel, camera card bad Temp tower: Regular data collection/cleaning, windy day
| 2020-07-30 Sherman Wetland I arrived at 9:15 PDT. It was a very windy day with cloudless skies. It was dry under the tower, and the water level was 31 cm. The reservoir was ½ full; I refilled it. I cleaned flux and rad sensors. The SWin and LWin sensors were a bit muddy and there were spiderwebs on the sonic transducers. I also tried cleaning the staff gauge, but it needs a green scrubby pad next time. I downloaded met, camera, USB GHG, and miniDOT data. There were only 2 days of photos on this card, and we saw this issue the last time the card was used, so it’s time to retire this card. I added a 5V-12V DC-DC converter for the ethernet switch and connected the camera and the datalogger to the switch. I checked the phenocam clock, which looked ok. I installed a replacement funnel for the precip bucket. I brought the black rubber band (from the old bucket) back to the lab. Both the eosGP and the miniDOT were above the water surface, and I lowered them into the water. I swapped the miniDOT desiccant. I planned to install a water level sensor, but forgot to bring conduit for the cable. No sense in putting it out only to get the cable damaged again. LI-7500 readings: CO2 393ppm H2O 700ppm T 18.7C P 101.5kPa SS 96--> 97 after cleaning LI7700 readings: CH4 1.85 ppm RSSI 37--> 71 after cleaning I left at 10:05 PDT. 2020-07-30 Sherman Wetland Temporary Tower I arrived at 10:25 PDT. It was a windy and sunny day with clear skies. There was no water under the tower. The wash reservoir was full, but the mirror spun (no spray) when I had just arrived around 10:30. I haven’t seen any problems with 7700 RSSI in the data, but I’ll keep on eye on it. I shooed away some wasps in the met box. I downloaded met, cam, and USB GHG data. I cleaned the flux and rad sensors and the picam winow. There were spiderwebs on the sonic. I forgot to clear the picam last time, so had to download 3.9 Gb of photos this time. This time, I made sure to delete the photos after downloading. LI-7500 readings: CO2 393pm H2O 730ppm T 20.7C P 101.7kPa SS 93--> 96 after cleaning LI7700 readings: CH4 1.9ppm RSSI 44--> 73 after cleaning I left at 11:15 PDT. |
2 photos found
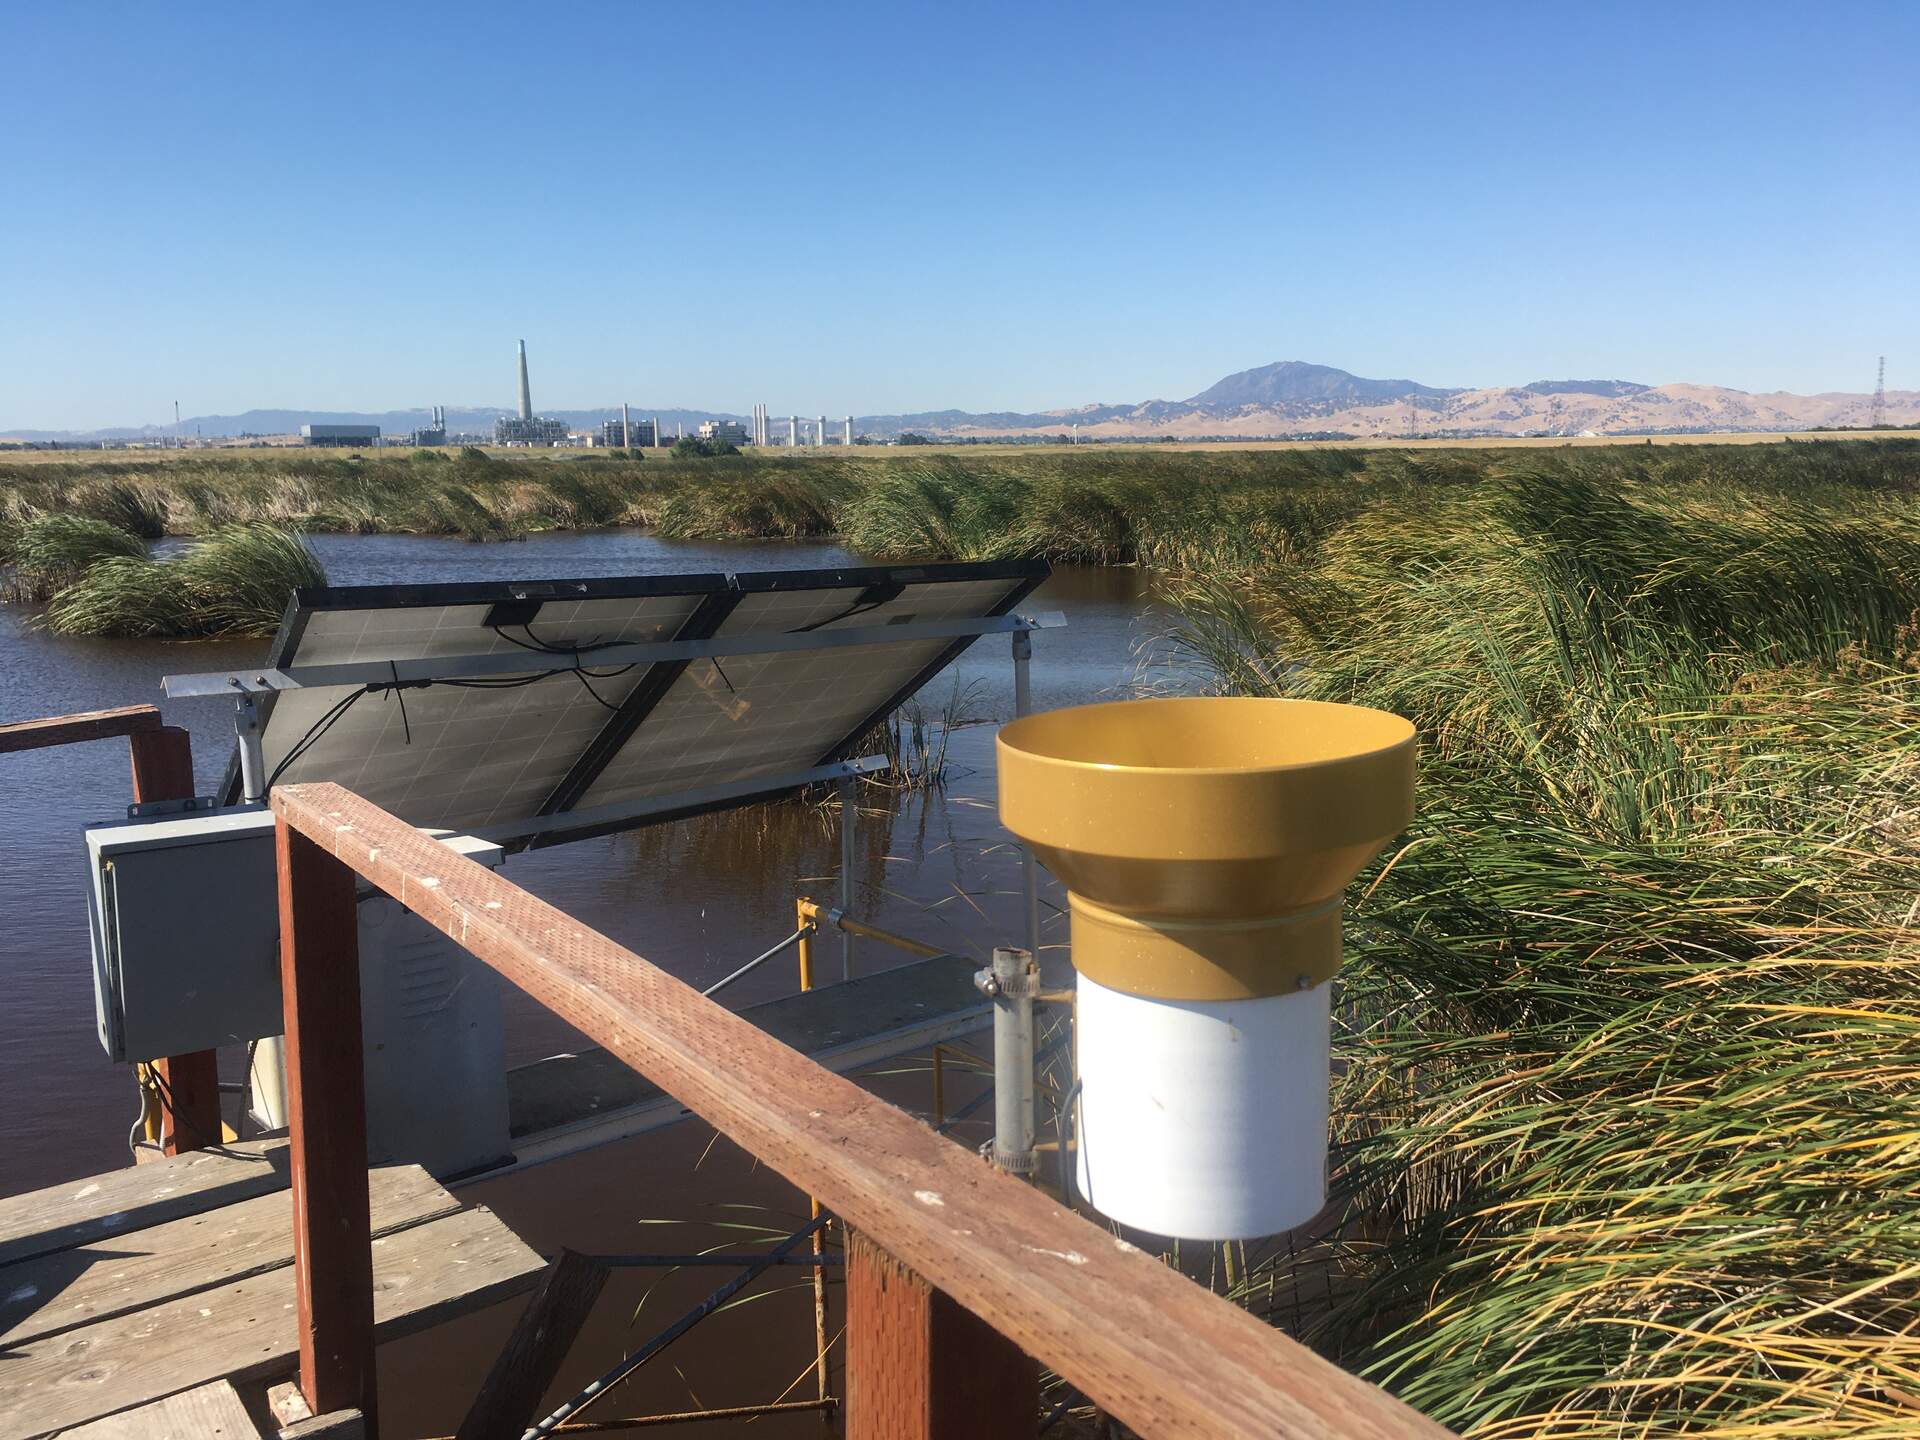
20200730SW_PrecipFunnel.jpg ( 2020-07-30 10:05:01 ) Full size: 1920x1440
New screw-type precip funnel installed at SW

siwetland_2020_07_30_114405.jpg ( 2020-07-30 11:45:20 ) Full size: 1296x960
Grackles
7 sets found
Can't check MBWPEESWGT_mixed
Can't check MBEEWPSWEPGT_cam
16 SW_met graphs found
4 SW_flux graphs found
Can't check MBSWEEWPBCBA
Can't check SW_Temp
14 SW_Temp graphs found
No data found for SW_arable.